Factsheet 8: Heatwaves


What are heatwaves?
Heatwaves are periods of unusually hot weather that can have serious impacts on human health and wellbeing, agriculture and the environment. The Queensland Future Climate Science Program calculates heatwaves using the Excess Heat Factor (EHF), which is the same method used by the Bureau of Meteorology. However, for our latest (CMIP6) estimates instead of using temperature, we use the heat-index, which incorporates temperature and humidity, which is particularly important in tropical regions in Queensland. Using this method, heatwaves are defined as periods of at least 3 days or more where the heat index is high compared to the recent and long-term past.
How are heatwaves analysed in climate projections?
The EHF considers both acclimatisation (the ability to adjust to the
change in the heat index from the recent past), and how high the heat
index is relative to the 95
The EHF is obtained by combining two indices - the EHIaccl and EHIsig. The heat acclimatisation index (EHIaccl) is calculated as the average heat index over the past 3 days compared to the average heat index over the previous 30 days (equation 1 below). The heat significance index (EHIsig) is the average heat index over the past three days compared to the 95th percentile over the calibration period, 1981 - 2010 (equation 2). The EHF is calculated as the product of these two indices (equation 3) where Ti is the heat index on a specific day.

A heatwave occurs when the EHF is 1.0 or more for at least three consecutive days. Based on this definition, we can calculate a time series of the EHF in the climate simulation data that can then be used to derive a number of heatwave metrics depicting its characteristics over a particular season and for different time periods in the future. As heatwaves are more frequent in warmer months (December, January and February), it is important to preserve the continuity of the summer season when representing its characteristics. Therefore, we provide heatwave indices for the 1 July - 30 June hydrological year.
The indices available on the Queensland Future Climate Dashboard and Regional Explorer under the Heatwave 'theme' are shown below in Table 1
Table 1: Heatwave indices.
| Heatwave Peak Temperature (CMIP5) | Maximum temperature (°C) of the hottest day of the season's hottest heatwave |
| Heatwave Peak Heat Index (CMIP6) | Maximum heat index (°C) of the hottest day of the hottest heatwave (also known as the heatwave amplitude) |
| Heatwave Frequency | Number of heatwave days in a season relative to the number of days in the season i.e. (Heatwave days / Number of days in season) * 100% |
| Heatwave Duration | Average duration of heatwaves in a season (days) |
| Maximum Heatwave Duration | Length of the longest heatwave in a season (days) |
For the heatwave frequency, duration and maximum duration variables, summer (December, January and February), autumn (March, April and May), winter (June, July and August), spring (September, October and November), wet (November to April) and dry (May to October) seasons are also available for selection in addition to the hydrological year. However, due to the infrequency of heatwave events in certain seasons during the reference period (1995-2014) and the difficulty in displaying changes in heatwave peak heat index when there were no events in the reference period, only the hydrologic year and wet season are provided as seasons for the peak heat index variable.
The figure below illustrates how heatwaves and their characteristics are identified and extracted from a temperature time-series. For additional information on heatwaves in Queensland, please visit the Heatwaves case study.

Heatwaves on Queensland Future Climate
The Queensland Future Climate Science Program has used state-of-the-art high-resolution downscaled climate simulations from both CMIP5 and CMIP6 global climate models to assess the impact of climate change on heatwaves.
The main tools for viewing climate projections data on the Queensland Future Climate website are the Queensland Future Climate Dashboard and Regional Explorer. Please refer to the user guide for detailed information on how to access and interpret information available from these resources.
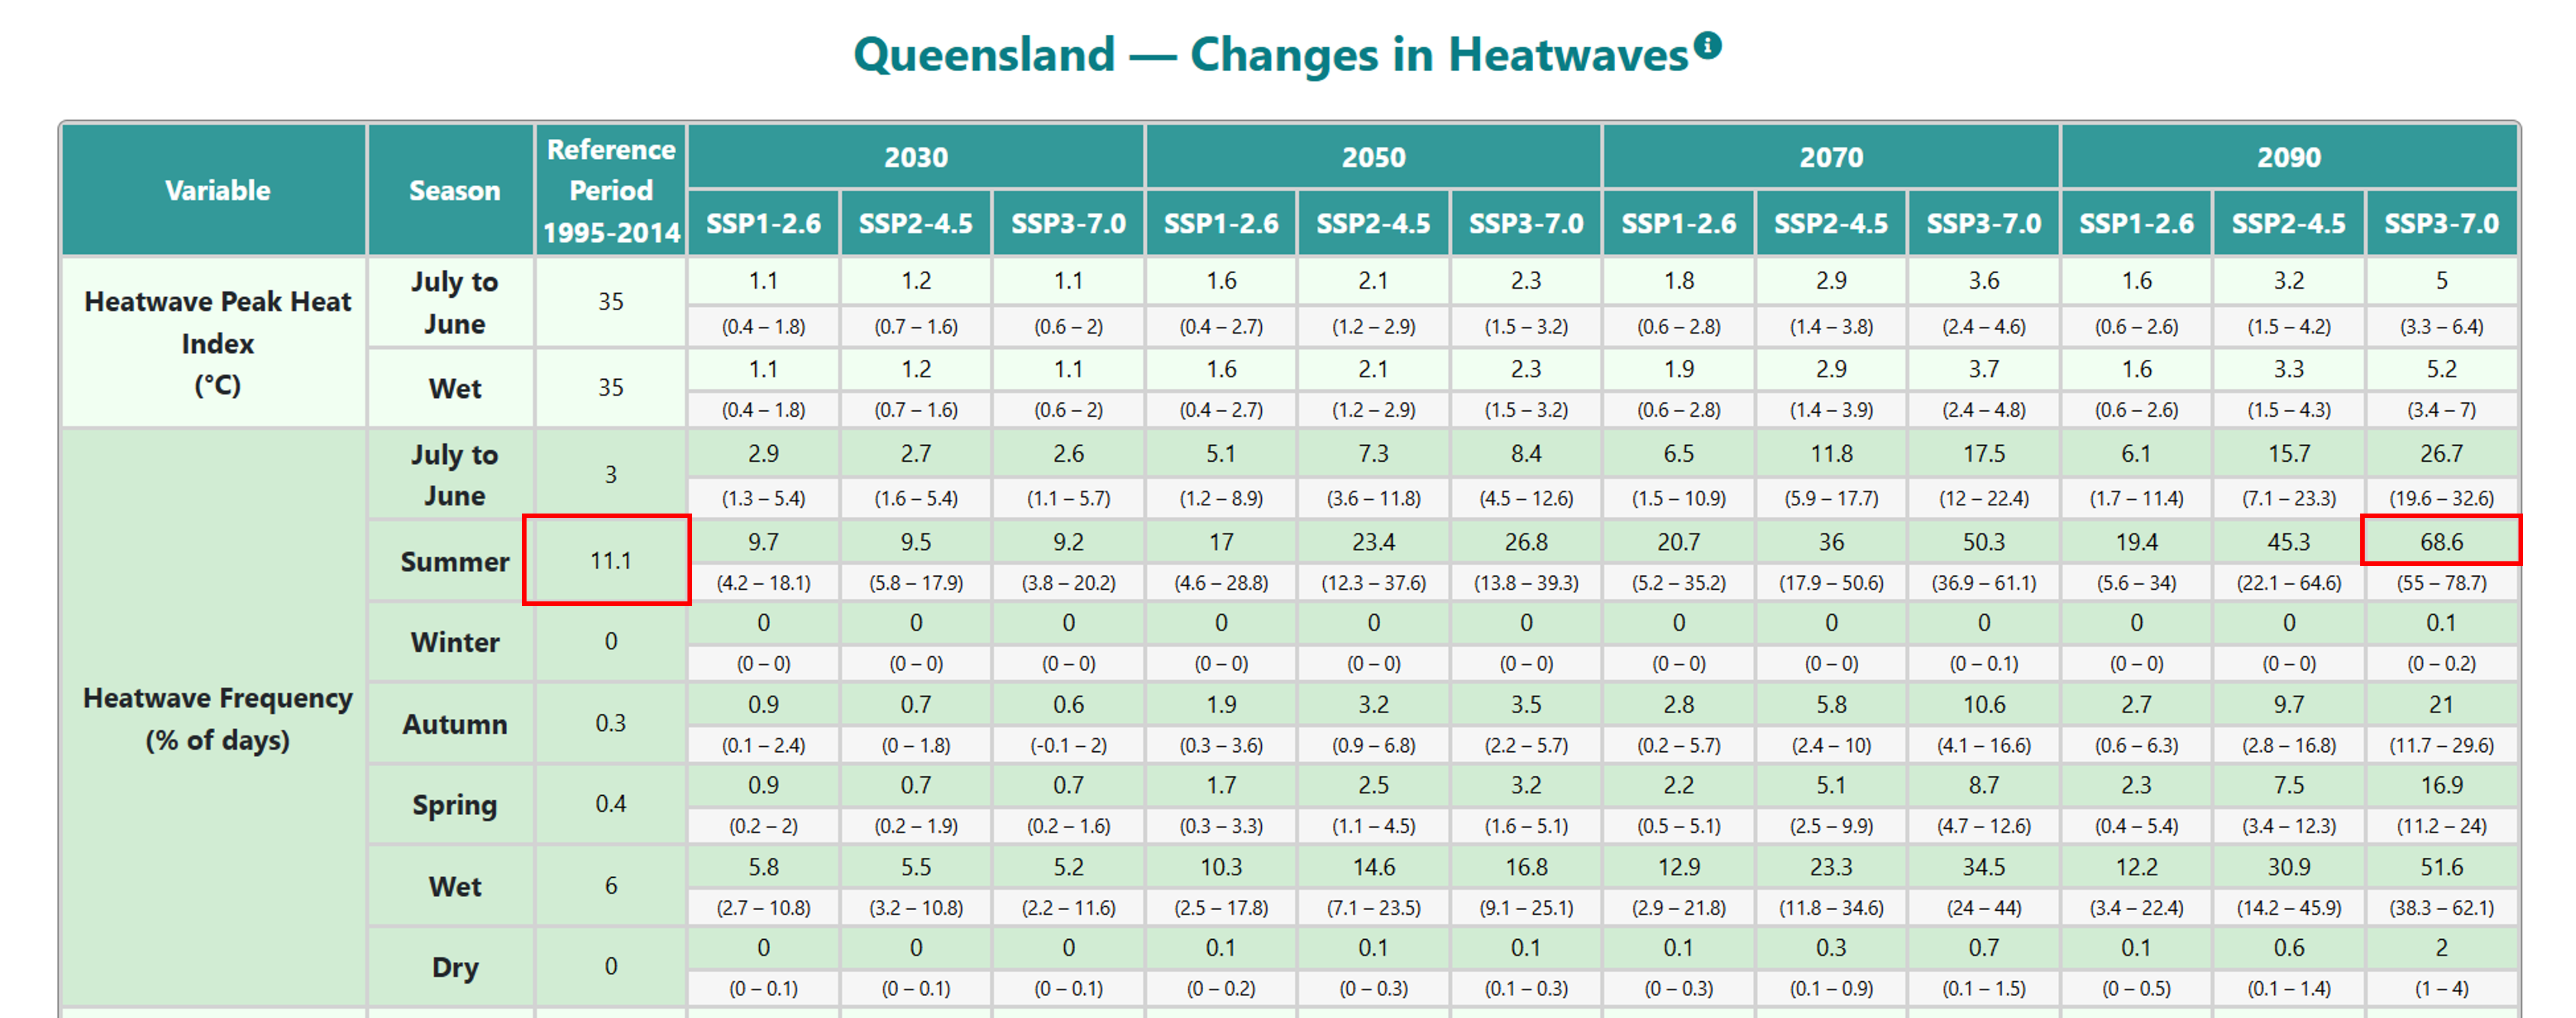
Examples of the heatwave information available on the Queensland Future Climate Dashboard and Regional Explorer are shown below.


The CMIP6 Queensland Future Climate Dashboard and Regional Explorer provide access to data on the four heatwave indices mentioned previously: Heatwave Peak Heat Index, Heatwave Frequency, Heatwave Duration and Maximum Heatwave Duration. The Heatwave Frequency variable is expressed as the percentage of the number of heatwave days in a season relative to the total number of days in the season. It is important to note that changes in this variable represent an absolute increase in the percentage of days classified as heatwave days, rather than a relative percentage increase. For example, under the SSP3-7.0 scenario, Queensland is projected to experience a mean increase in the number of summer heatwave days of 68.6% by 2090. This represents an increase from the reference value of 11.1% to a total projected frequency of 79.7% (11.1% + 68.6% = 79.7%), which equates to approximately 72 heatwave days during the summer season by 2090 under SSP3-7.0 (see figure below).

References
Nairn, J. R., and R. J. B. Fawcett. 2015. The Excess Heat Factor: A Metric for Heatwave Intensity and Its Use in Classifying Heatwave Severity. International Journal of Environmental Research and Public Health 12:227-253.
Trancoso, R., J. Syktus, N. Toombs, D. Ahrens, K. K. H. Wong, and R. Dalla Pozza. 2020. Heatwaves intensification in Australia: A consistent trajectory across past, present and future. Science of the Total Environment 742:140521.
