Tropical Cyclone information page
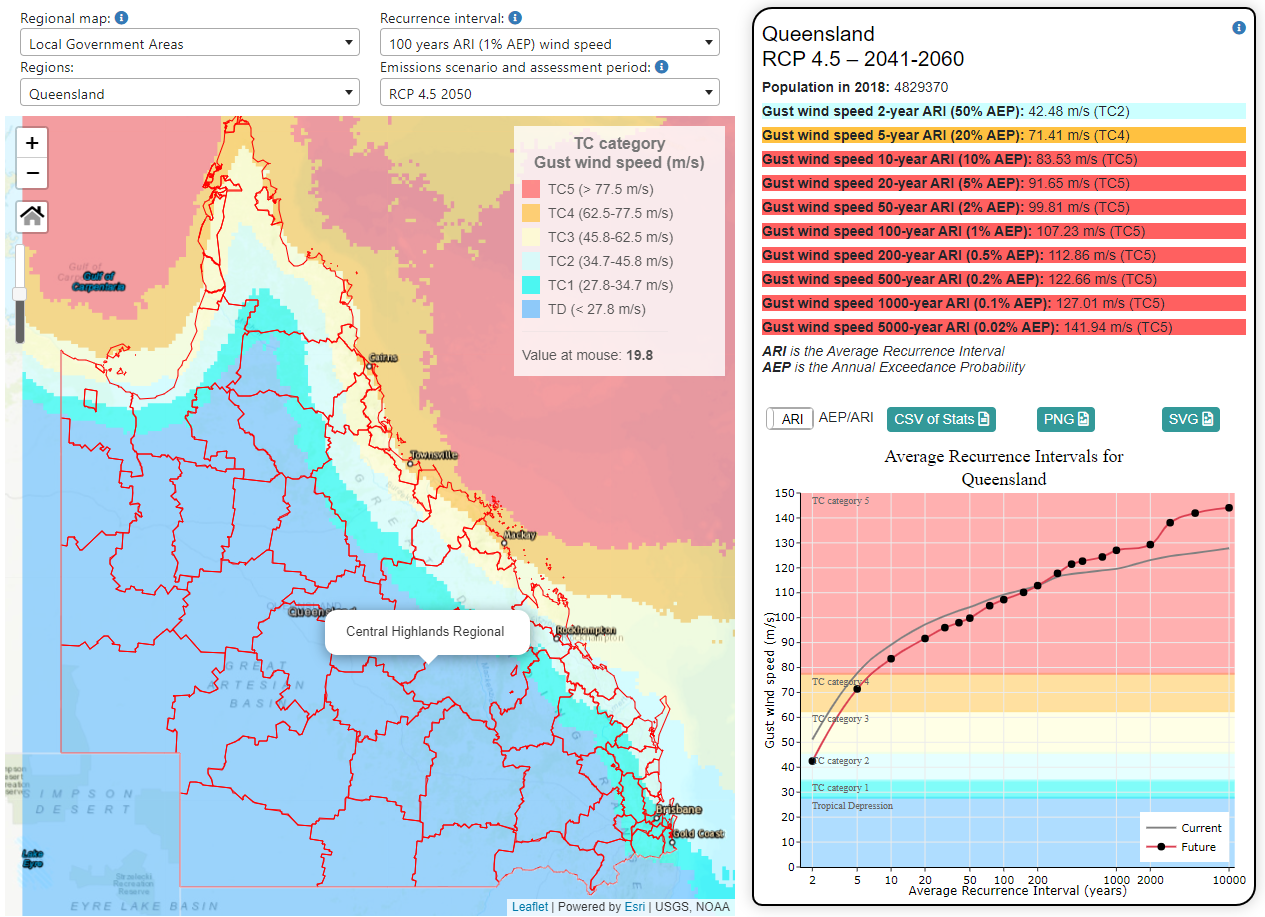
The Tropical Cyclone Hazard Dashboard (TC–) is an interactive visualisation platform for current and future tropical cyclone (TC) wind hazard to support the Severe Wind Hazard Assessment for Queensland (SWHA-Q). It allows users to understand the change in likelihood of TC-related winds across a range of regions and locations in Queensland. The TC– is composed of drop-down menus, maps, plots, and tables whereby users can customise, visualise, and export current and future TC wind hazard information summarised for Queensland’s regions and locations.
The TC– integrates observed TC tracks and the Queensland Future Climate projections to understand the severe wind hazard posed to Queensland. The SWHA-Q and the TC– estimate the current and future wind hazards using the Tropical Cyclone Risk Model (Arthur, 2021) and the regional climate modelling and analysis described below. The modelled outcomes may differ based on assumptions, such as emission scenarios, time horizons and different implementations of the climate system physics. Climate modelling is a rapid progressing field and future updates to science are expected to improve the estimates of wind hazard.
Aims
The SWHA-Q aims to better understand the potential impacts of current and future modelled TCs across Queensland’s regions and better communicate the projected changes in cyclone behaviour across Queensland.
The TC– aims to inform Queenslanders about the outcomes of the SWHA-Q through a user-friendly interface where users can interactively visualize and access current and future modelled TC wind hazard profiles for several regions and locations.
Methods
Assessing the current and future TC hazard across Queensland’s regions and localities required a number of techniques and approaches. High-resolution climate projections were produced for Queensland and their TC tracks were identified, bias-corrected and clustered. Then, a statistical model was fitted for current and future TC wind hazard. TC hazard profiles were then regionalized for Queensland’s regions and locations and presented at an interactive visualisation platform (i.e., the TC–). A brief description of the modelling steps is provided below. For a more detailed overview check the SWHA-Q technical reports (Reports one, two and Executive Summary).
For more information about state-wide risk and hazard assessments visit QFES webpage.
· Historical dataset
The historical simulations were performed based on the IBTrACS (International Best Track Archive for Climate Stewardship; Schreck et al, 2013), which provides global tropical cyclone best track data in a centralized location to aid our understanding of the distribution, frequency, and intensity of tropical cyclones worldwide. The World Meteorological Organization Tropical Cyclone Programme has endorsed IBTrACS as an official archiving and distribution resource for tropical cyclone best track data. The first version of the TC– used modelled TC tracks over the entire Australia following the Tropical Cyclone Hazard Assessment (TCHA; Geoscience Australia). However, it was later updated to a new version based solely on the modelled TC tracks over the Queensland region (refer to SWHA-Q report one for details) to allow better parametrization of the model and optimised representation of specific TC patterns for the state.
· Downscaling climate projections
The underlying data for future assessment was obtained by dynamically downscaling 11 CMIP-5 General Circulation Models using the CSIRO’s Conformal Cubic Atmospheric Model (CCAM; McGregor and Dix, 2008; Thatcher and McGregor, 2011). The CCAM was forced by bias-corrected sea surface temperature (SST) data (Hoffmann et al., 2016). Visit the Understanding the data webpage for a detailed overview of the downscaling methodology. For the sake of future TC risk assessment, two emission scenarios and two time-slices have been considered: RCP 4.5 (moderate emissions scenario), RCP 8.5 (high emissions scenario), mid-century (2041-2060) and end-of-century (2081-2100).
· Identification of TC tracks
The detection and tracking algorithm based on Walsh (1997) works by identifying features in the climate simulations output that resemble TCs, providing information on the location and intensity of Tropical Cyclone-Like Vortices (TCLVs), which can be used as an equivalent dataset to observed tracks for input into stochastic hazard models. The TCLVs were extracted from the downscaled simulations by adapting the thresholds for the resolution of the downscaled climate simulations (Walsh et al., 2013). Detection was done with 6 hourly data from the downscaled climate simulations after data was resampled to 30 km of spatial resolution.
· Bias correction of TCLVs
Intensity of TCLVs (measured by central pressure deficit) were scaled using quantile delta mapping (Cannon et al., 2015) to ensure the distribution of intensity of TCLVs in the reference period (1981-2010) matched the observed distribution from historical records. The relative change in quantiles between reference and future time periods is also conserved.
· Clustering of TCLVs ensembles
To ensure the hazard projections were based on sufficient records of input data, the TCLVs have been merged into two statistical ensembles. The models were grouped based on the frequency of events in the reference period. The aggregation of the 11 CCAM ensembles into two TC ensembles of 100 (i.e., five 20-year climate ensembles) and 120 years (i.e., six 20-year climate ensembles) of TCLV activity provided more robust track statistics for the statistical modelling. The statistical ensemble with five CCAM runs was used because it was based on an updated CCAM version and had smaller bias.
· Statistical modelling of TC wind hazard
The SWHA-Q used Geoscience Australia’s Tropical Cyclone Risk Model (TCRM; Arthur, 2021) to evaluate ARI wind speeds across Australia. The TCRM is a statistical-parametric model based on historical TC activity. The model derives statistical relations for TC behaviour (genesis rate and location, intensity, speed and direction of translation) from best-track datasets, then uses these relations to create a synthetic catalogue based on stochastic sampling, representing 10,000 years of TC activity. The TCRM generates a collection of tracks, and the associated wind fields around each track, which can in turn be used in hazard and impact assessment applications. In addition to the historical assessment, the TCRM was also used with the TCLVs extracted from Queensland’s downscaled climate simulation to evaluate future risk of TCs.
· Regionalization of TC wind hazard for regions and locations
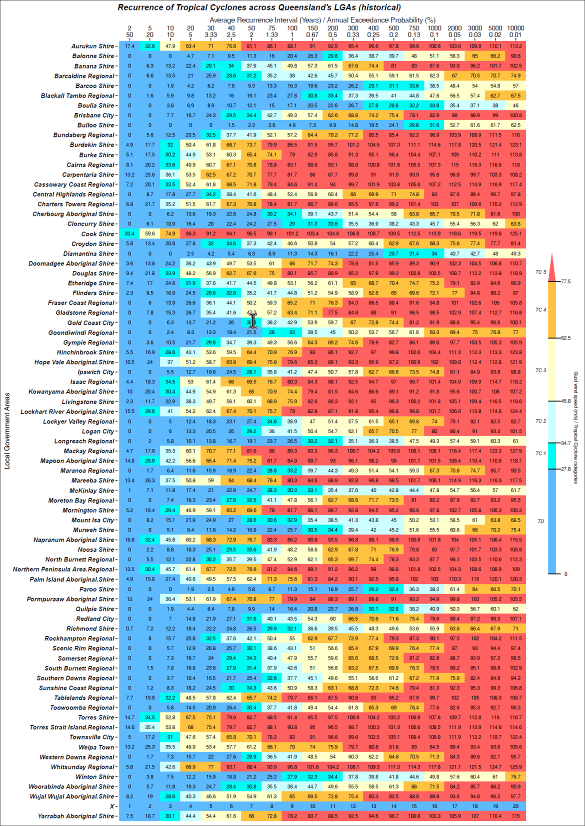
Two different approaches were employed to assess the TC wind hazard across regions and locations: the region-based approach and the point-based approach. The region-based approach utilizes the maximum gust wind speed generated by the associated wind fields of the TC events within a region. The region-based hazard profile indicates the spatially aggregated hazard across an entire region – that is how often a TC event exceeding a given magnitude is expected to occur anywhere within a region such as a Local Government Area (LGA). This approach was used to inform the TC wind hazard for LGAs, regional plan areas, river basins, bio-regions and disaster districts. The region-based hazard profile is useful for broad-scale risk management and preparedness.
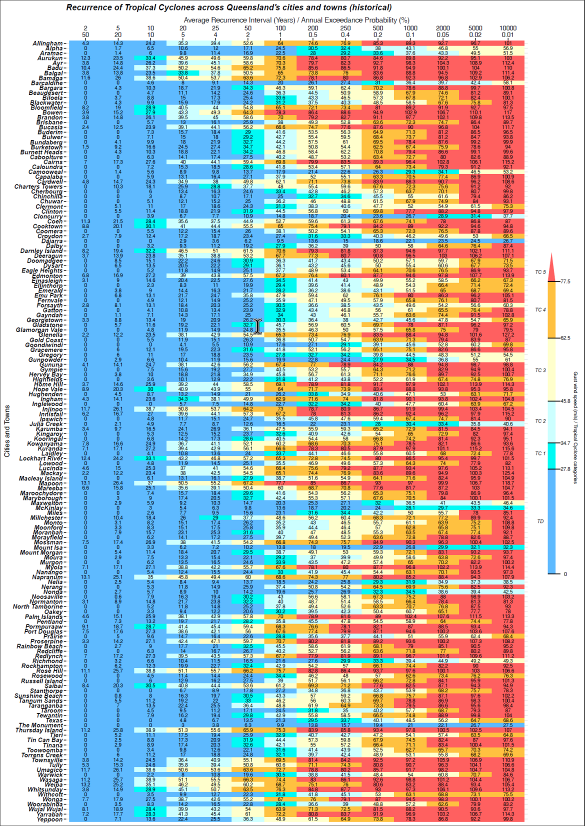
The point-based approach utilizes the actual TC winds influencing a certain location represented by a pair of spatial coordinates (latitude and longitude). No spatial aggregation was used. The point-based hazard is more appropriate to inform the hazard profile of specific locations represented by a pair of spatial coordinates such as cities, towns and communities. For both region-based and the point-based approaches, wind speeds were ranked and return intervals were calculated as Average Recurrence Interval (ARI) and Annual Exceedance Probability (AEP). Then, in order to scale future ARI and AEP curves to current curves, the difference between the future climate runs (2041-2060 and 2081-2100) to the reference period (1981-2020) was summed to the current (based on historical TC tracks) curves.
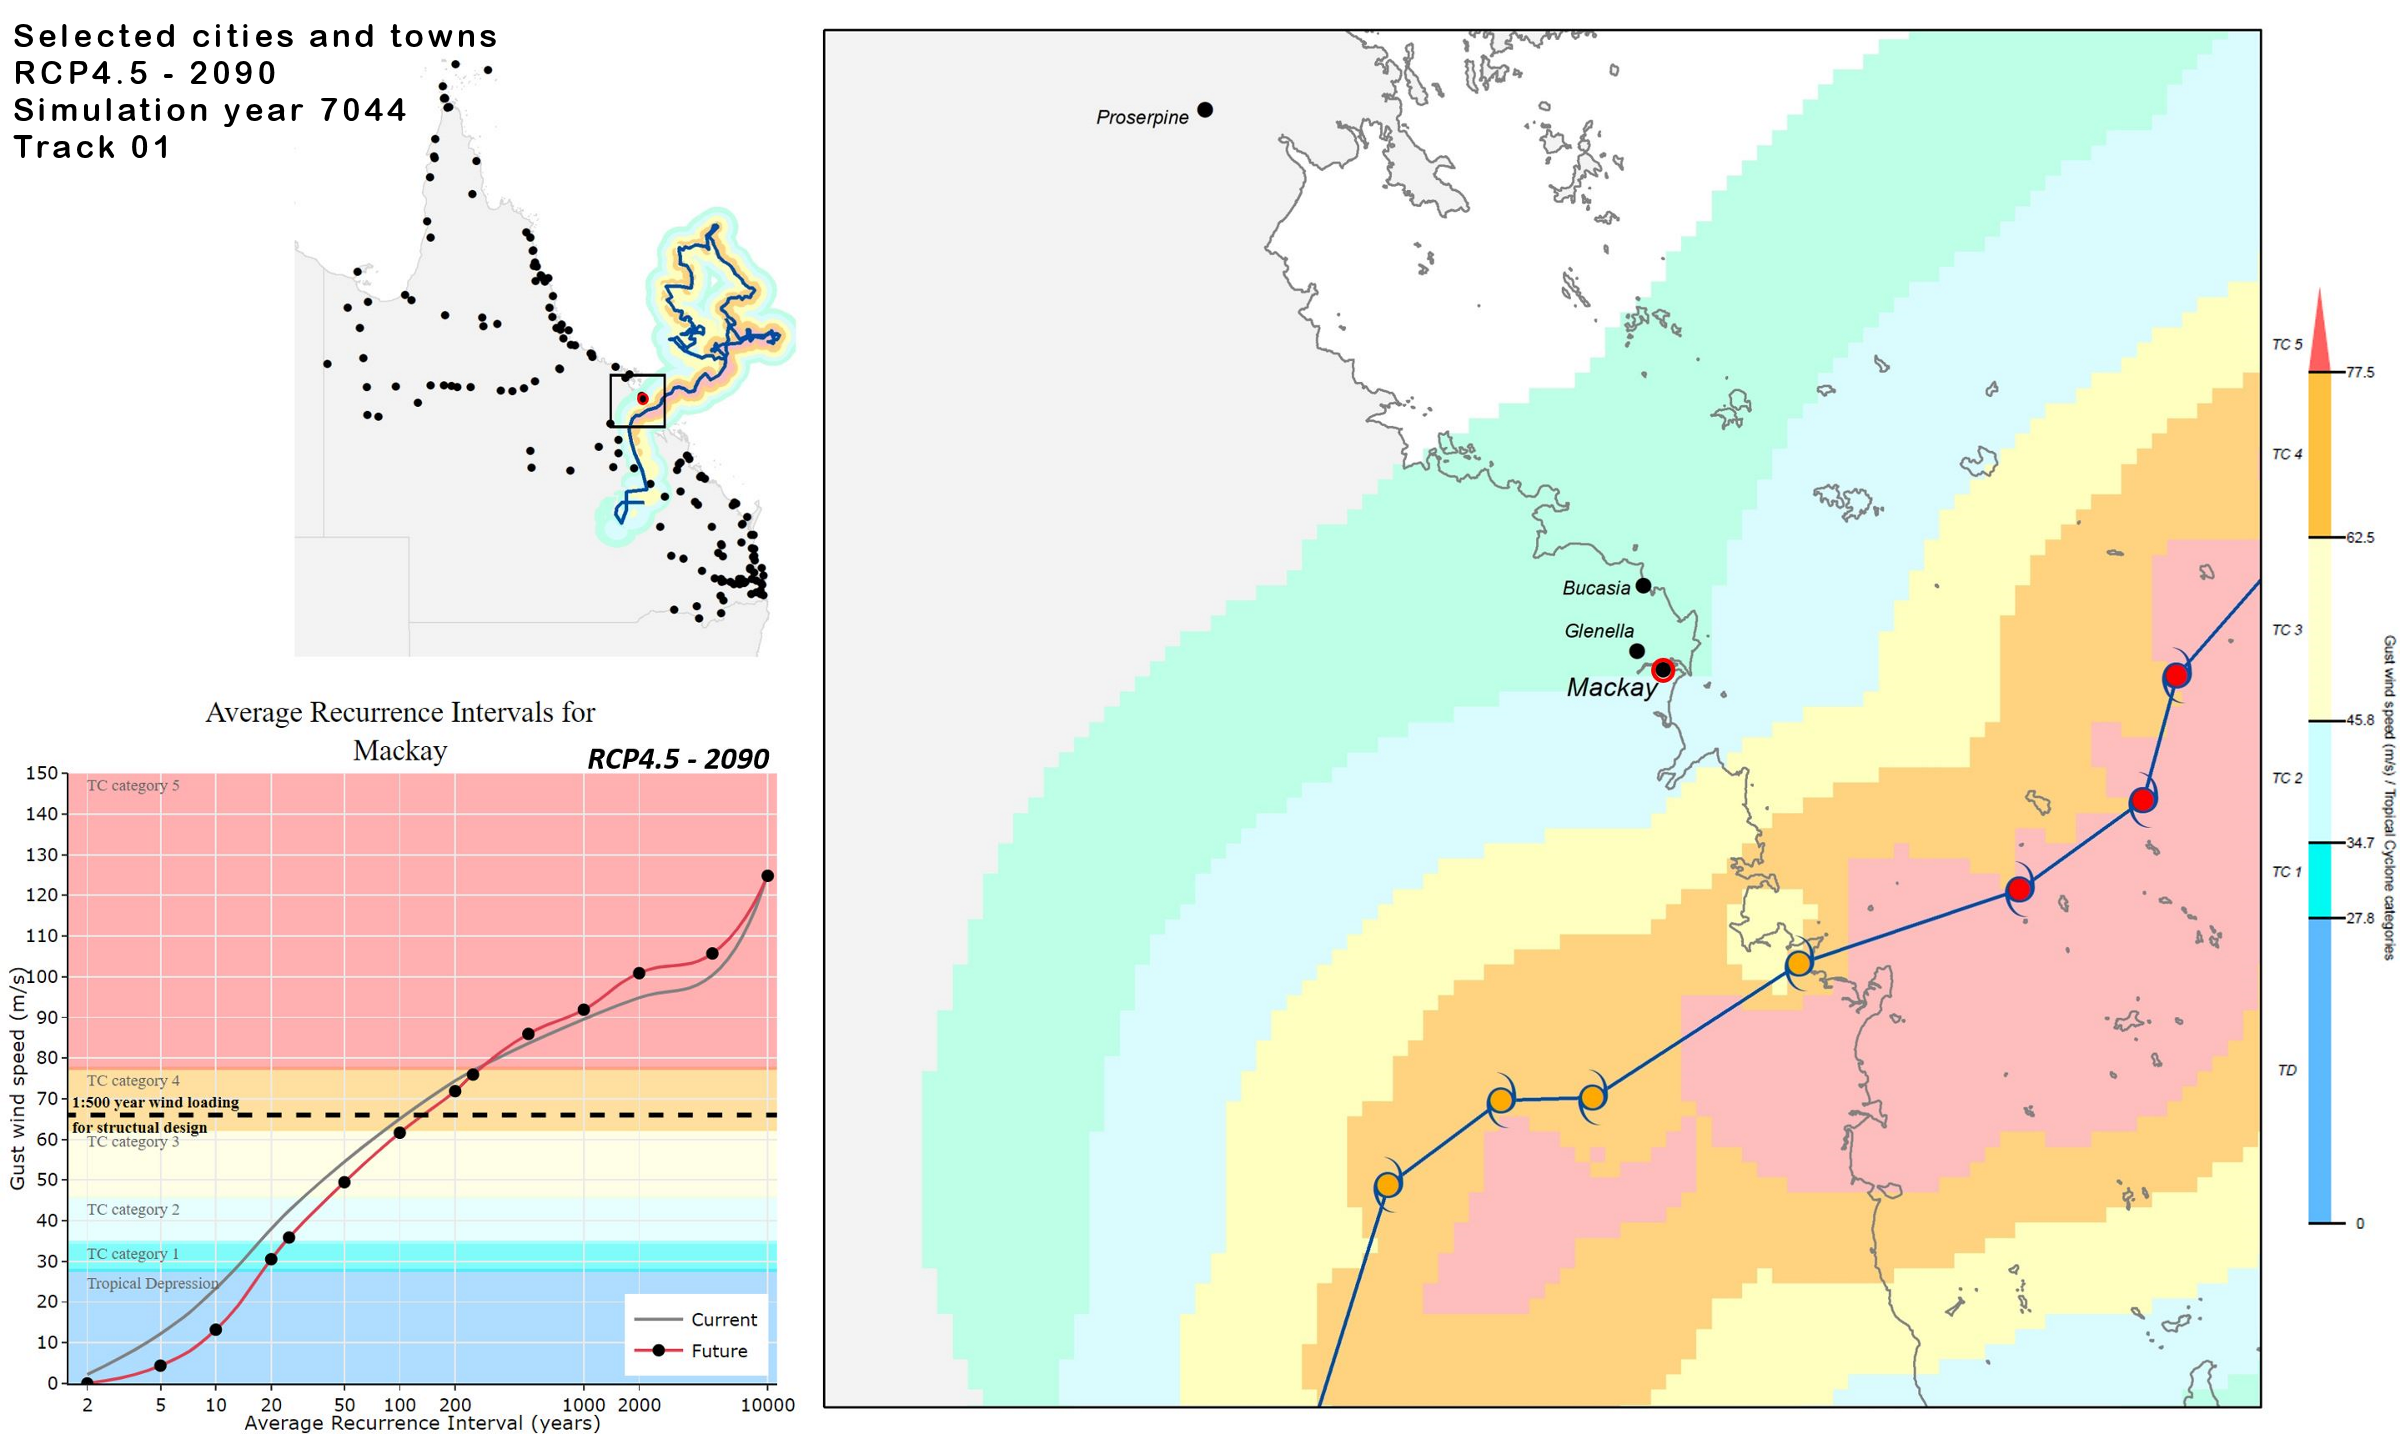
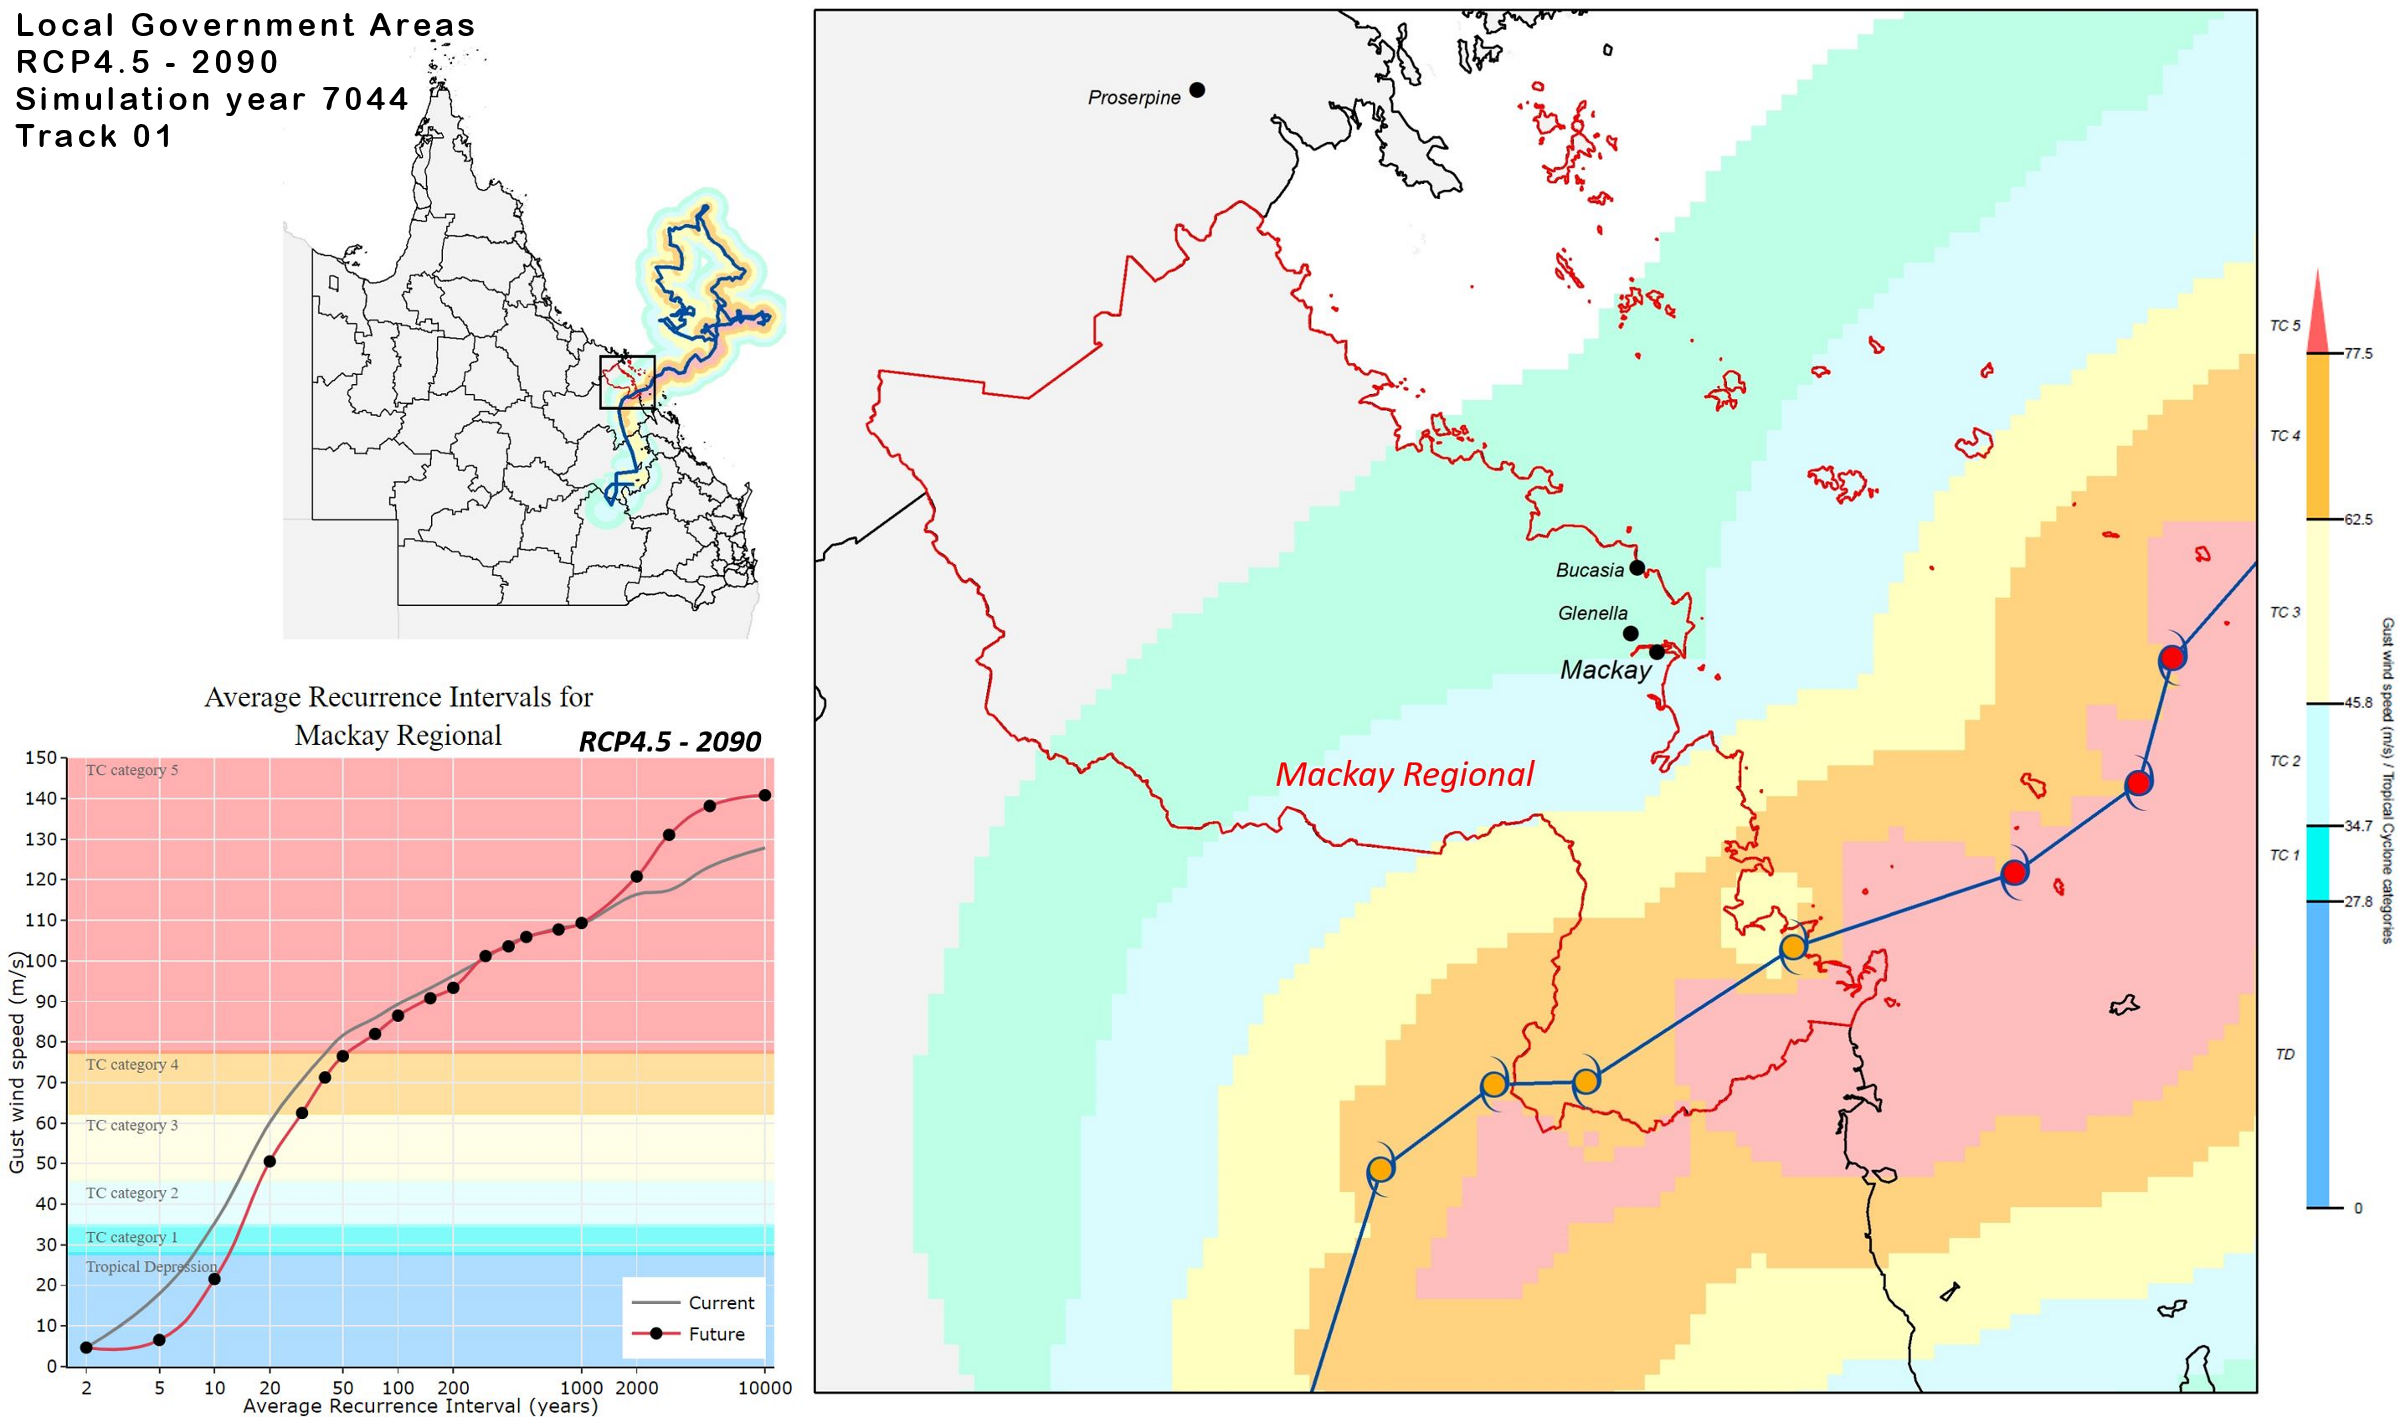
In the example below a synthetic TC event extracted from the future simulations catalogue makes landfall with category 4 wind speed about 45 km south of the city of Mackay. Yet, the city of Mackay and communities on its surrounds have only experienced category 1 wind speed. Conversely, category 5 wind speeds reached the southern border of the Mackay Regional Council area. This illustrates that an entire region is always more likely to experience severe winds than any individual location within the region as the region integrates the probabilities of all locations within it. Therefore, greater hazard should be expected for regions when compared to locations as shown in the Average Recurrence Interval plots.
Point-based regionalization
This selected synthetic TC event made landfall with category 4 winds about 45 km south of the city of Mackay. However, the wind speeds in the city of Mackay were category 1.
City of Mackay
Region-based regionalization
The winds for this same selected synthetic TC event reached category 5 in the south border of the Mackay regional although it made landfall as a category 4 event.
Mackay Regional
Check the current and future hazard profiles for Queensland’s LGAs (region-based) and Queensland’s cities and towns (point-based).
How to interpret the TC wind hazard profiles
The wind hazard profiles provided by the TC– can inform a range of end-users with varying backgrounds. Click on the different personas below to understand how end-users can potentially use the assessment outcomes to make strategic decisions on their sectors.
-
 Emergency management
 -
 Research scientist
 -
 Policy and environment
 -
 Built environment
 -
 General public
Visit the Tropical Cyclone Hazard Dashboard to access current and future TC hazard profiles across Queensland’s regions and locations. Read the SWHA-Q technical reports (Reports one, two and Executive Summary) for additional information and assessment details
Disclaimer
The TC- provides access to the SWHA-Q model’s output and was designed to facilitate the visualization of modelled current and future TC wind hazards. It does not supersede building code advice nor imply design values. Users are advised to seek expert opinion to support their interpretation of these results for their intended purpose. Depending on the use-case, a locally specific detailed tropical cyclone hazard and risk analysis may be required to support the specific application.
References
Arthur, W. C. (2021) A statistical-parametric model of tropical cyclones for hazard assessment Natural Hazards and Earth System Science, doi.org/10.5194/nhess-2019-192.
Cannon, A. J., S. R. Sobie, and T. Q. Murdock (2015) Bias Correction of GCM Precipitation by Quantile Mapping: How Well Do Methods Preserve Changes in Quantiles and Extremes? Journal of Climate, 28, 6938-6959, 10.1175/jcli-d-14-00754.1.
Hoffmann, P., J. J. Katzfey, J. L. McGregor, and M. Thatcher (2016) Bias and variance correction of sea surface temperatures used for dynamical downscaling. Journal of Geophysical Research Atmospheres, 121, 12,877-812,890, 10.1002/2016jd025383.
McGregor, J., and M. R. Dix (2008) An Updated Description of the Conformal-Cubic Atmospheric Model. High Resolution Numerical Modelling of the Atmosphere and Ocean, K. Hamilton, and W. Ohfuchi, Eds., Springer, 51-75.
Schreck, Carl & National Center for Atmospheric Research Staff (Eds). Last modified 06 Nov 2013. "The Climate Data Guide: IBTrACS: Tropical cyclone best track data." Retrieved from https://climatedataguide.ucar.edu/climate-data/ibtracs-tropical-cyclone-best-track-data.
Siqueira, A., W. C. Arthur, and H. M. Woolf (2014) Evaluation of severe wind hazard from tropical cyclones - current and future climate simulations : Pacific-Australia Climate Change Science and Adaptation Planning Program. Geoscience Australia Record, 47, http://www.ga.gov.au/corporate_data/79681/Rec2014_047.pdf.
Thatcher, M., and J. L. McGregor (2011) A Technique for Dynamically Downscaling Daily-Averaged GCM Datasets Using the Conformal Cubic Atmospheric Model. Monthly Weather Review, 139, 79-95.
Walsh, K. J. E. (1997) Objective Detection of Tropical Cyclones in High-Resolution Analyses. Monthly Weather Review, 125, 1767-1779, 10.1175/1520-0493(1997)125<1767:ODOTCI>2.0.CO;2.
Walsh, K., S. Lavender, E. Scoccimarro, and H. Murakami (2013) Resolution dependence of tropical cyclone formation in CMIP3 and finer resolution models. Climate Dynamics, 40, 585-599, 10.1007/s00382-012-1298-z.
