Indicative Soil Phosphorus Report
What is an Indicative Soil Phosphorus report?
The Indicative Soil Phosphorus report provides the ‘inherent’ (i.e. natural soil with no P fertiliser application) ‘plant available’ soil phosphorus (P) concentration (indicative – with respect to mapping) and the areas of different soil P categories for different Grazing Land Management (GLM) land types for the selected Lot(s) on Plan (see map [right] and extent note [below]). The information about soil P in the report can assist graziers to improve the efficiency of supplementation for livestock production, fertiliser application and legume development through improved awareness of soil P availability for properties.
Note: The report now includes Gulf and Cape York regions (previously unavailable) with data from updated sampling and analyses - statewide (see MLA 2024 report). As the spatial prediction of plant-available soil phosphorus is constantly evolving, the current mapping will be superseded whenever new analyses are completed, reviewed and provided for use in the FORAGE system.
Why is Soil Phosphorus important?
The status of soil P affects the P concentration in pastures which plays an essential role for conversion of grass to energy in livestock body, growth and the development of body tissue, development of foetus and production of milk in pregnant and lactating cows. Extremely low or very low available P soils may result in low plant available P and hence P deficiency in cattle. Symptoms of P deficiency include bone chewing, which also increases the risk of cattle contracting botulism. More comprehensive details and symptoms on P deficiency can be found in the Reference list (under FAQ).
Videos about Phosphorus supplementation:
Mapping the Future: Updating Queensland’s Phosphorus Landscape
Phosphorus supplementation at Kidman Springs - FutureBeef website
Phosphorus supplementation of cattle in northern Australia - FutureBeef website
What is included in the report?
The Indicative Soil Phosphorus report includes:
- Soil P Map (Page 1)
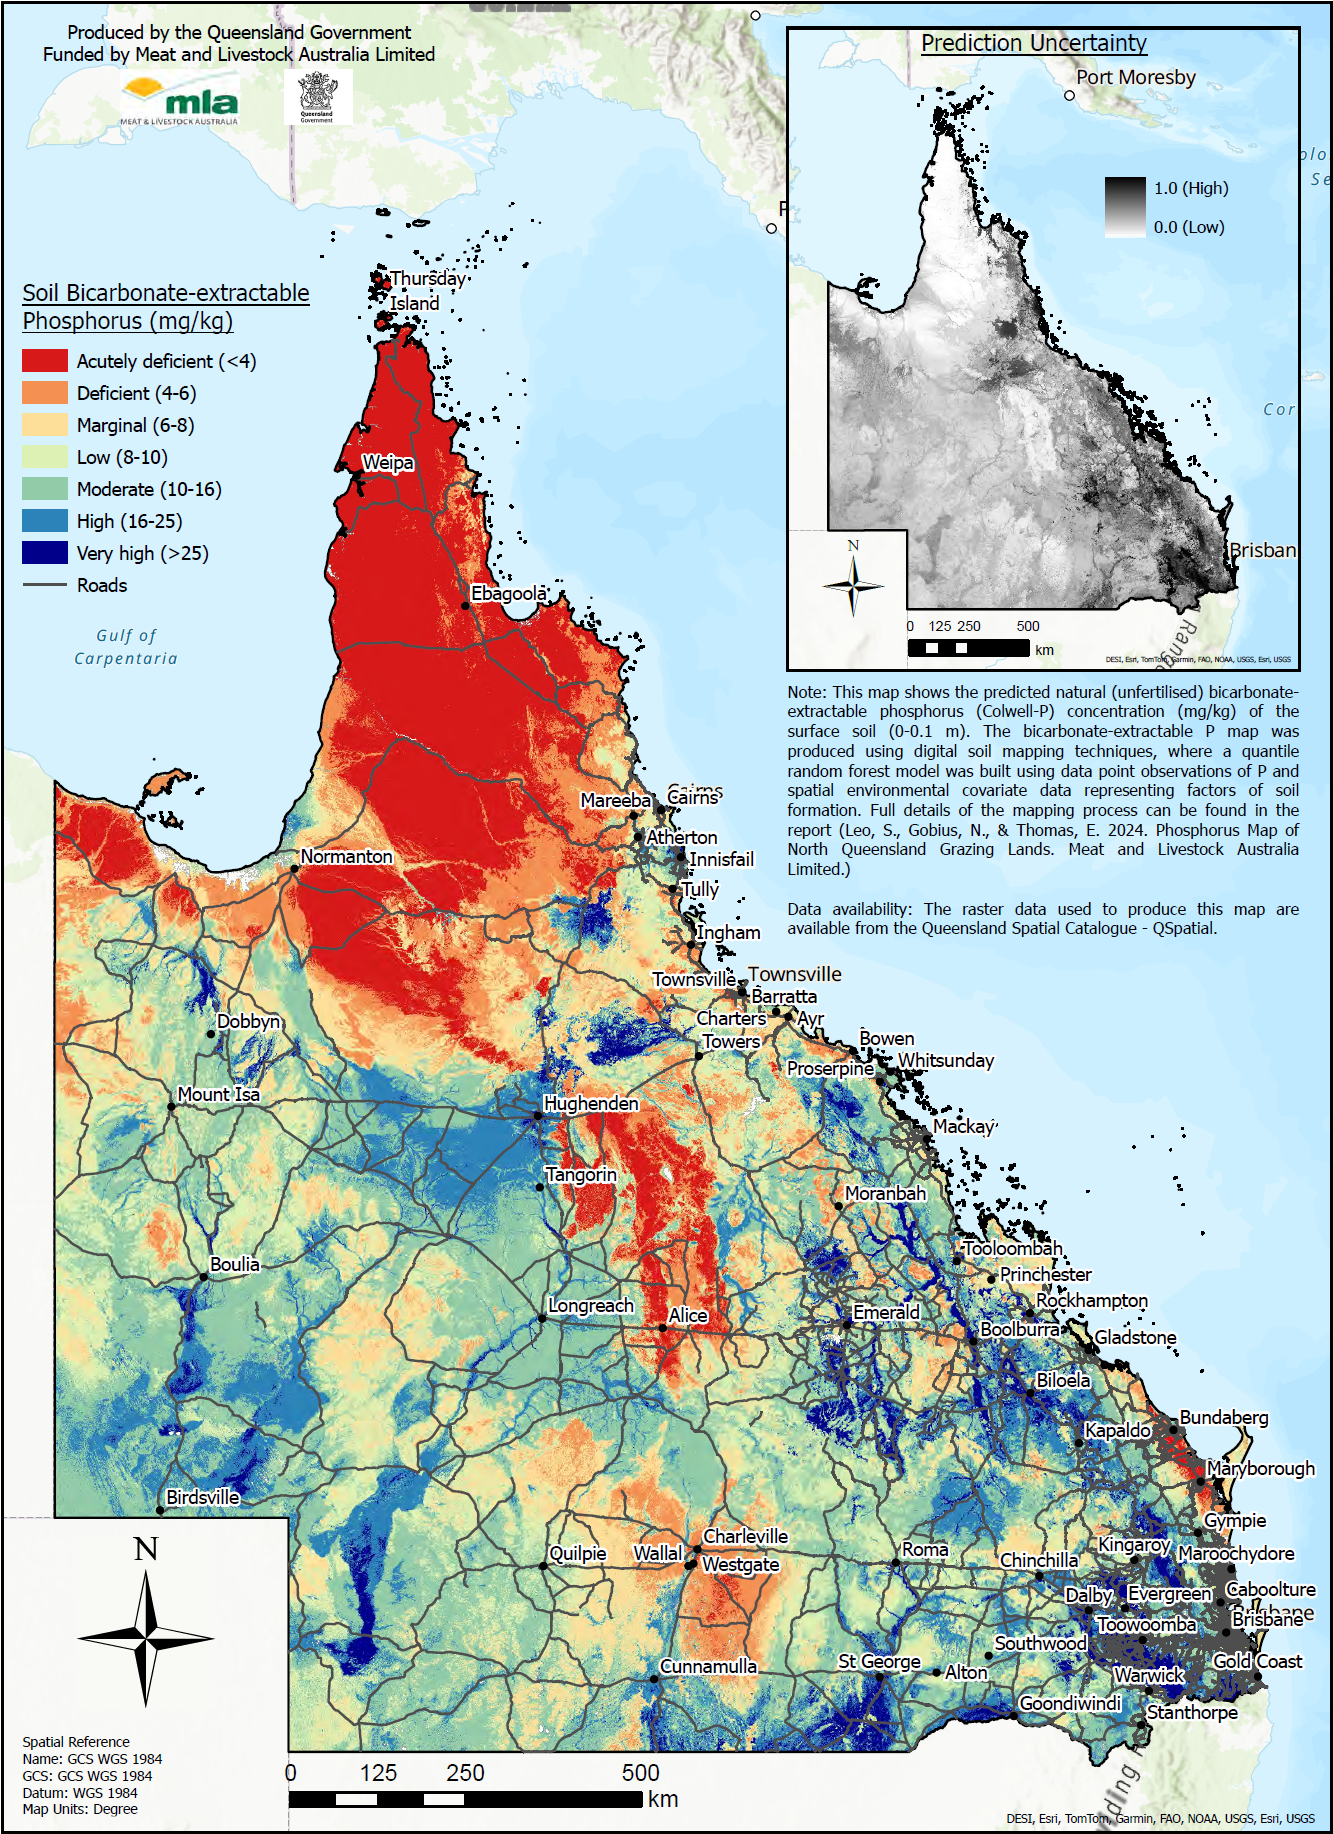
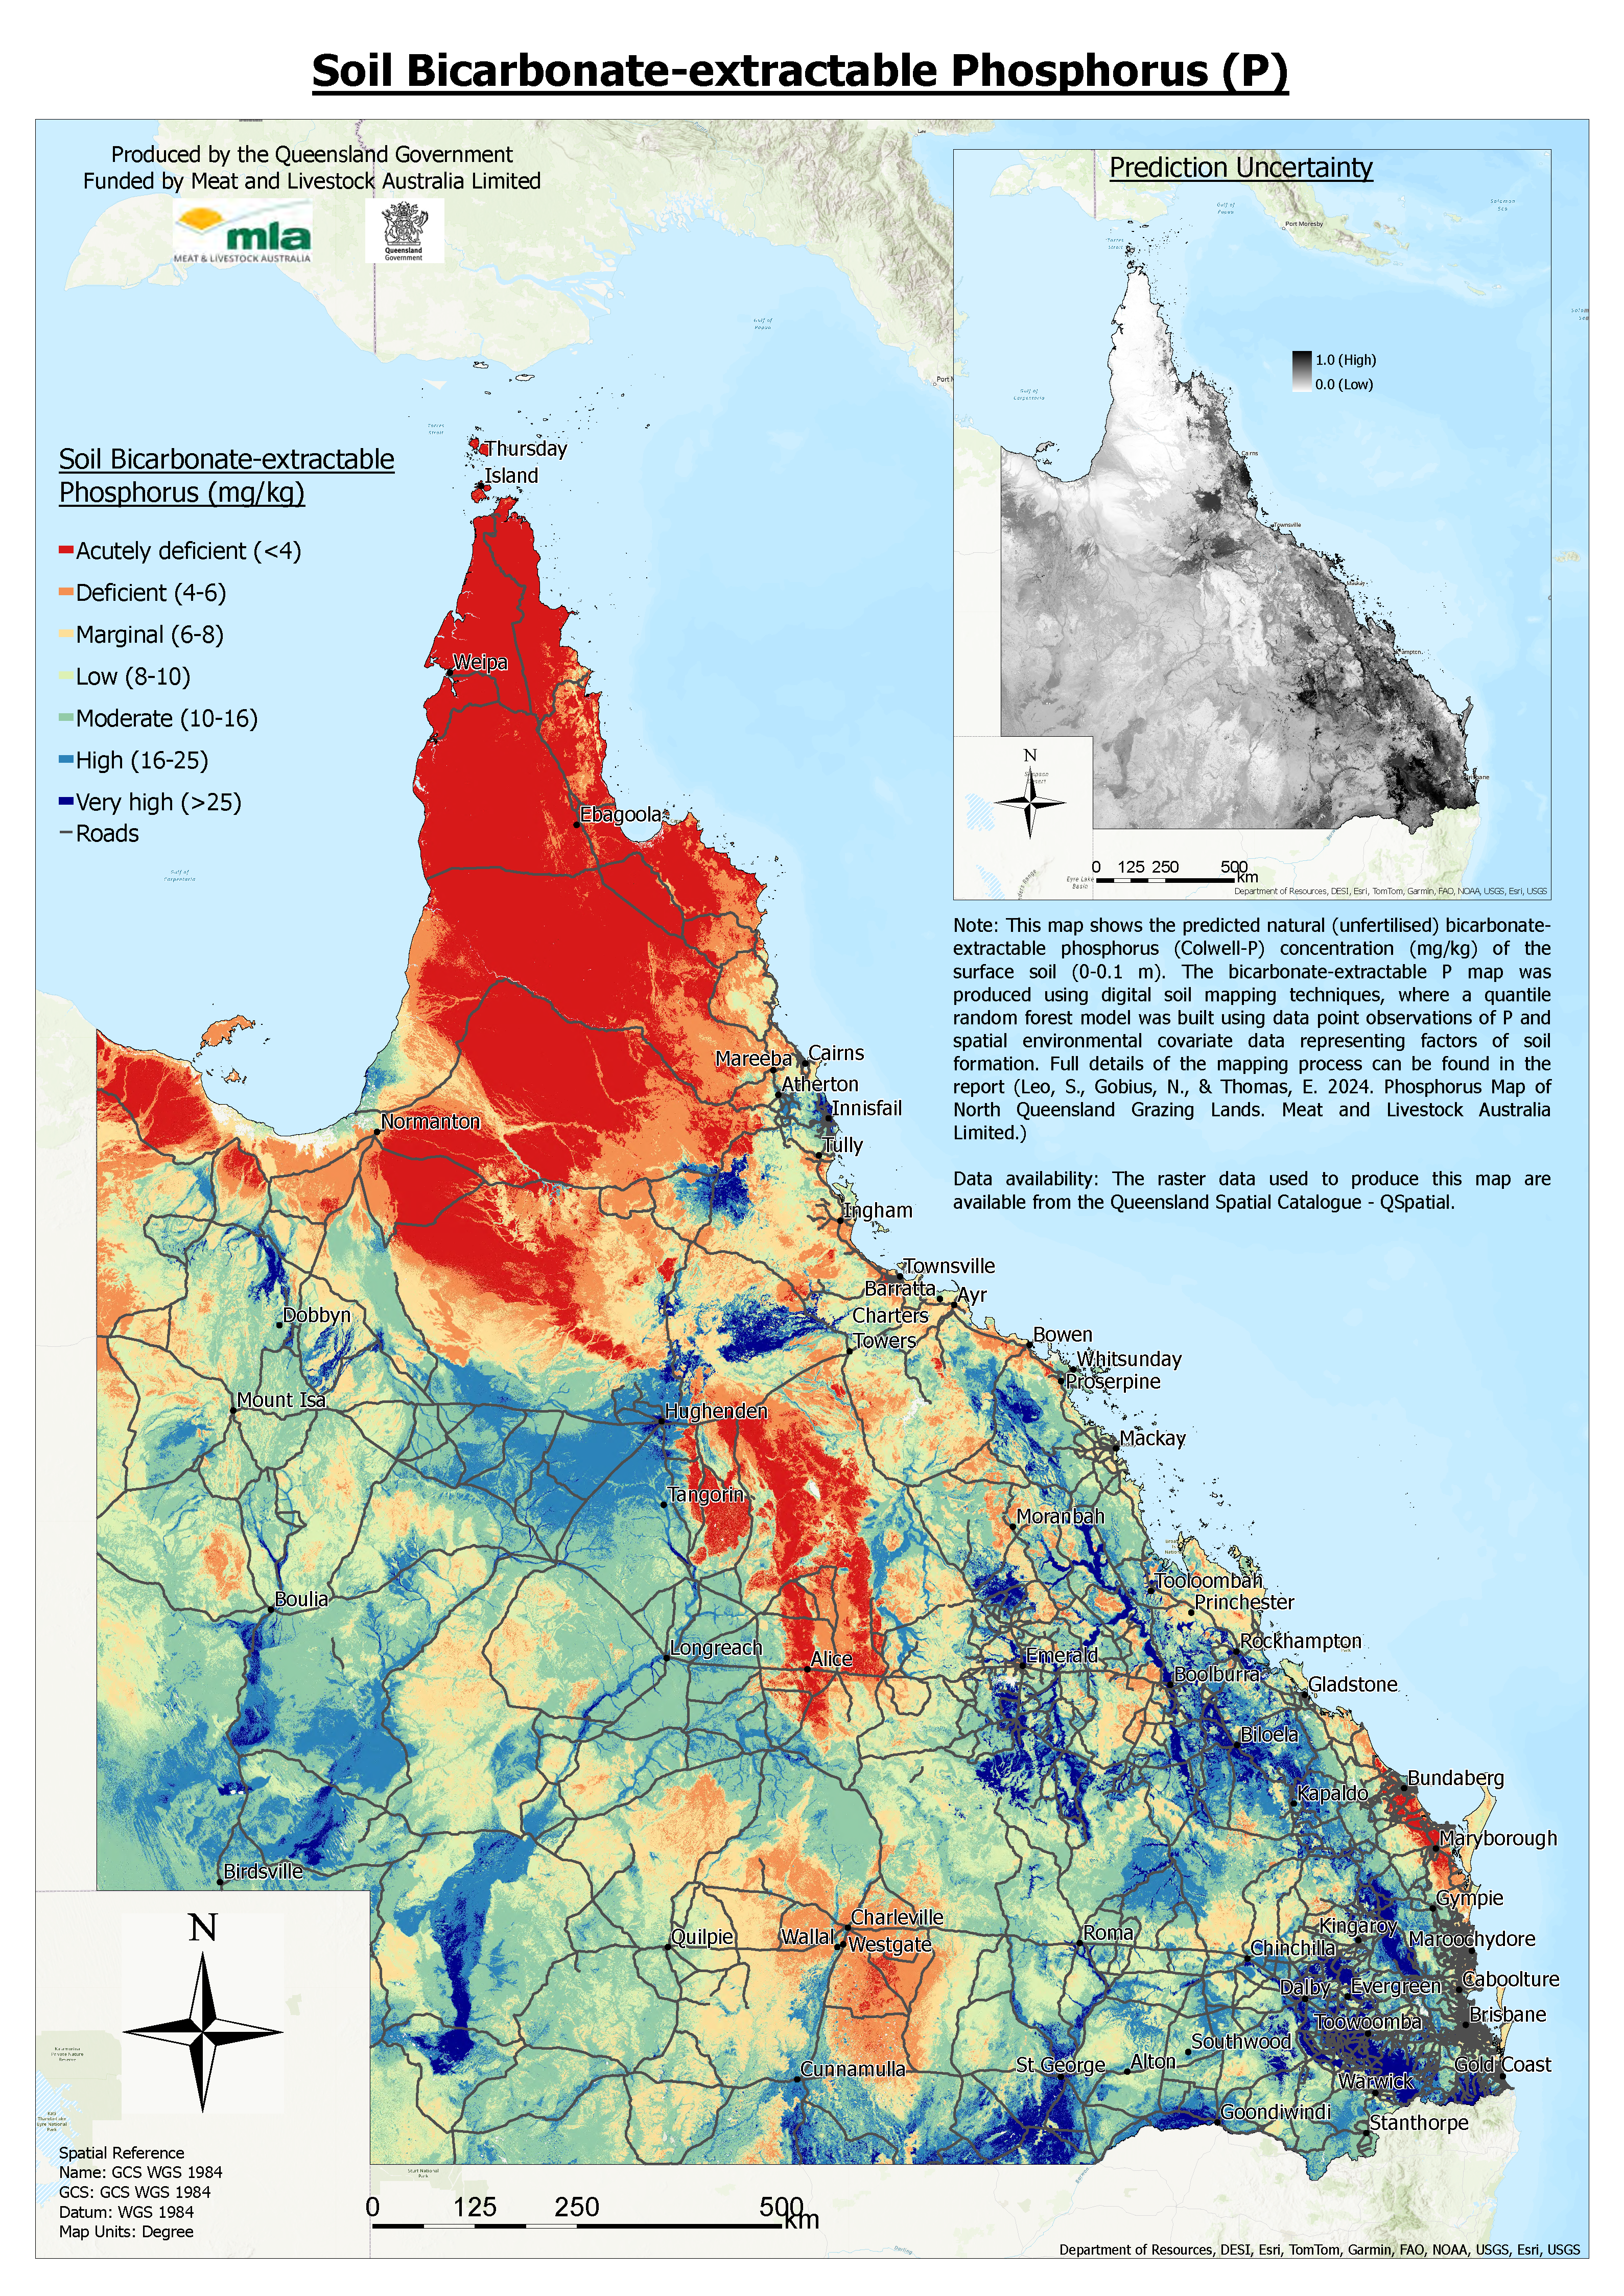
The property-scale map of soil P shows the soil P concentration that has been estimated using digital soil mapping methods from site locations with bicarbonate extractable P (Colwell-P) results within surface soils (0-10cm). The results are measured in the unit of ’parts per million’ (ppm, mg/kg). The green dots on the map show the locations where soil samples have been analysed for Colwell-P. The P samples have been collected by soil surveyors since the 1960s.
Note: while bicarbonate extractable P is a better measurement of biological availability than total P, it may still not indicate true plant availability in all cases. For example, in iron rich soils, P may be less available to plants than indicated by this analysis - due to the P-binding nature of these soils.
- Classification of Soil P for Land Types (Page 2)
A table shows the indicative area (ha) and percentage of different soil P categories that are present for each GLM land type in the selected Lot(s) on Plan. The categories are classified based on soil P concentrations and include: Extremely Low (0-4ppm); Very Low (4-6ppm); Low (6-9ppm); Moderate (9-15ppm); High (15-25ppm); and Very High (>25ppm).
- Map of Soil P Data Uncertainty (Page 3)
This map indicates the uncertainty of soil P data (i.e. very low - very high uncertainty) in the Soil P Map (page 1). High uncertainty is likely to be due to a paucity of soil sample measurements and the high natural variability of soil P.
- A reference list
The reference list provides publications in which the detailed phosphorus information on soils, plants and animal nutrition and well-being can be found.
- A GeoPDF file
A GeoPDF is a georeferenced or geospatial PDF file. It relates an image from the PDF report to coordinates on a map – allowing the user to have some limited mapping functions such as turning map layers on and off.
The GeoPDF for this report can be used in applications such as Avenza maps or Adobe Acrobat.
Note: there are no legends on the geoPDF files. To understand the categories when you are using the geoPDFs onsite, you need to reference the legend on the pdf report (digital or printed).
Report sample
Report quick guide (PDF, 4.1 MB)
Subscription option
Periodic subscriptions (1, 2 or 3 months) are available for this report. See here for more information on how to subscribe and unsubscribe.
Common questions about Indicative Soil Phosphorus report
The status of soil P affects the P concentration in pastures which plays an essential role for conversion of grass to energy in livestock body, growth and the development of body tissue, development of foetus and production of milk in pregnant and lactating cows. Extremely low or very low available P soils may result in low plant available P and hence P deficiency in cattle. Symptoms of P deficiency include bone chewing, which also increases the risk of cattle contracting botulism.
The Soil P map is based on data from Queensland predicted soil bicarbonate-extractable phosphorus - based on data from products (2024) P_mgkg_var5_COG.tif, P_mgkg_var50_COG.tif, P_mgkg_var95_COG.tif and P_uncertainty_COG.tif of Queensland Spatial Catalogue (https://qldspatial.information.qld.gov.au/catalogue). The map has a spatial resolution of 30M, and the map accuracy depends on soil uniformity and density of soil sampling in any region. The GLM land type information is based on "SIRQRY.DAF_GLM_LAND_TYPES_V6" dataset.
Soil P concentration has been estimated using digital soil mapping methods from site locations with bicarbonate extractable P (Colwell-P) within surface soils (0-10cm. A synthesis of the data and analyses can be found in the MLA (2024) report B.GBP.0063 - Phosphorus Map of Queensland Grazing Lands 2 | Meat & Livestock Australia
While bicarbonate extractable P is a better measurement of biological availability than total P, it may still not indicate true plant availability in all cases. For example, in iron rich soils, P may be less available to plants than indicated by this analysis - due to the P-binding nature of these soils. This is referred to as the phosphorus buffering capacity. The uncertainty of the predicted soil P map is shown in an uncertainty map (page 3). High uncertainty is likely to be due to a paucity of soil sample measurements and high natural variability of soil P.
The sub catchment to property-scale map of soil P and the areas of different soil P categories for different Grazing Land Management (GLM) land types can assist graziers improve the efficiency of supplementation for livestock production, fertiliser application and legume development through improved awareness of soil P availability.
See below for references that contain detailed Phosphorus information on soils, plants, animal nutrition and well-being.
Note: While bicarbonate extractable P is a better measurement of biological availability than total P, it may still not indicate true plant availability in all cases. For example, in iron rich soils, P may be less available to plants than indicated by this analysis - due to the P-binding nature of these soils. The uncertainty map (Page 3) indicates the uncertainty of soil P data in the Soil P Map (page 1). High uncertainty is likely to be due to a paucity of measurements and high natural variability of soil P.
The accuracy of the map will vary, particularly in relation to how many samples were present in an area. In general, the density of sites used to predict the map is low. Further on-site sampling is recommended to determine actual P values more accurately.
If you consider there are major discrepancies with the Soil P mapping in the report for your property, you can contact: longpaddock@qld.gov.au and relate the details.
A member of our team will then contact you to discuss the mapping issue.
Many properties may not have green dots on the map due to having no detailed soil survey carried out.
The Soil P map is based on data from the Queensland predicted soil bicarbonate-extractable phosphorus - based on data from products (2024) P_mgkg_var5_COG.tif, P_mgkg_var50_COG.tif, P_mgkg_var95_COG.tif and P_uncertainty_COG.tif of Queensland Spatial Catalogue (https://qldspatial.information.qld.gov.au/catalogue).
If you identify sites where there have been samples taken historically on your property, but they are not showing up on the map, please contact: longpaddock@qld.gov.au. A member of our team will then contact you to discuss the mapping issue.
Any new soil P data collected and submitted for inclusion in modelling will eventually contribute to a better soil P map for this report in the future.
See below for references that contain detailed Phosphorus information on soils, plants, animal nutrition and well-being.
Phosphorus supplementation at Kidman Springs - FutureBeef website
Phosphorus supplementation of cattle in northern Australia - FutureBeef website
Ahern C.R. et al. (1994). The soil fertility of central and north-east Queensland grazing lands, ISBN 0724259201, Queensland Department of Primary Industries, Q194065.
Jackson D. et al. (2012). Phosphorus management of beef cattle in northern Australia. Meat & Livestock Australia. http://publications.mla.com.au/login/GetDocViewer/11-10699.pdf
McCosker T.H. and Winks L. (1994). Phosphorus nutrition of beef cattle in northern Australia, ISSN 0727-6273, Queensland Department of Primary Industries, GPO Box 46, Brisbane, Qld 4001.
Meat & Livestock Australia. FutureBeef: Phosphorus supplementation of cattle in northern Australia. https://futurebeef.com.au/resources/phosphorus-supplementation-of-cattle-in-northern-australia/.
Meat & Livestock Australia. Phosphorus hub. https://www.mla.com.au/research-and-development/livestock-production/livestock-nutrition/phosphorus-hub/.
Meat & Livestock Australia. (2024) B.GBP.0063 - Phosphorus Map of Queensland Grazing Lands 2. https://www.mla.com.au/research-and-development/reports/2025/b.gbp.0063---phosphorus-map-of-queensland-grazing-lands-2/
Acknowledgement
We acknowledge the work of numerous soil scientists, chemists, researchers and field staff who collected and analysed soil samples - and we also thank the many landholders for on-property access to collect samples since collections commenced. We also acknowledge the continuing support from Meat and Livestock Australia for funding that has contributed to the soil P sampling and soils modelling to generate the data used in the FORAGE Indicative Soil Phosphorus report.
