Australia's Variable Rainfall
Poster showing inter-annual (April to March) rainfall variability for Australia
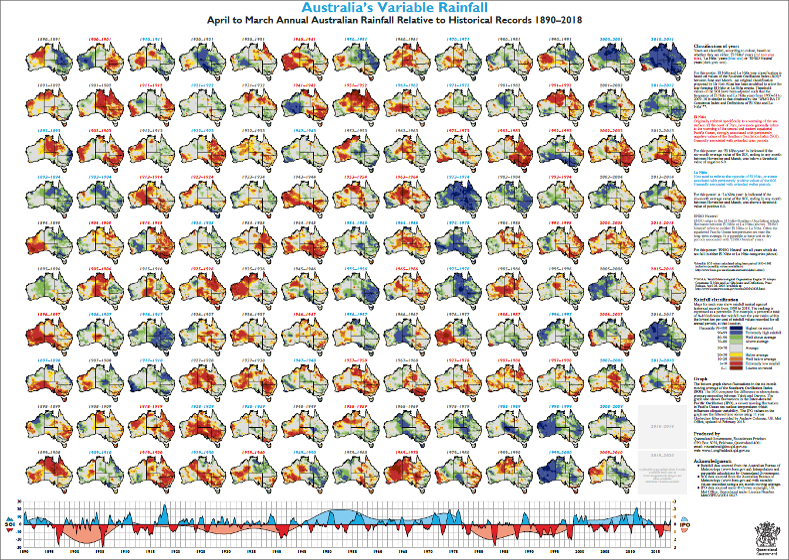
Australia's Variable Rainfall poster
This version of Australia's Variable Rainfall Poster depicts twelve monthly rainfall (April-March) in maps for the years 1890 through to 2018 alongside a graph of Southern Oscillation Index and Inter-decadal Pacific Oscillation values.
Australia's Variable Rainfall poster (1890 – 2018) (PDF)
Note: This poster replaces previous versions that covered periods 1900 to 1997, 1890 to 2004, 1890 to 2013 and 1890 to 2015. The April to March period best captures ENSO periods and is useful in most areas of the country.
- Maps for updating the previous versions of the posters. This update contains maps for years (2016/17 and 2017/18) for all posters and can be used to extend your current A1 printed posters to 2017/18. (PDF)
Additional new posters now available online
Last updated: 24 May 2024
