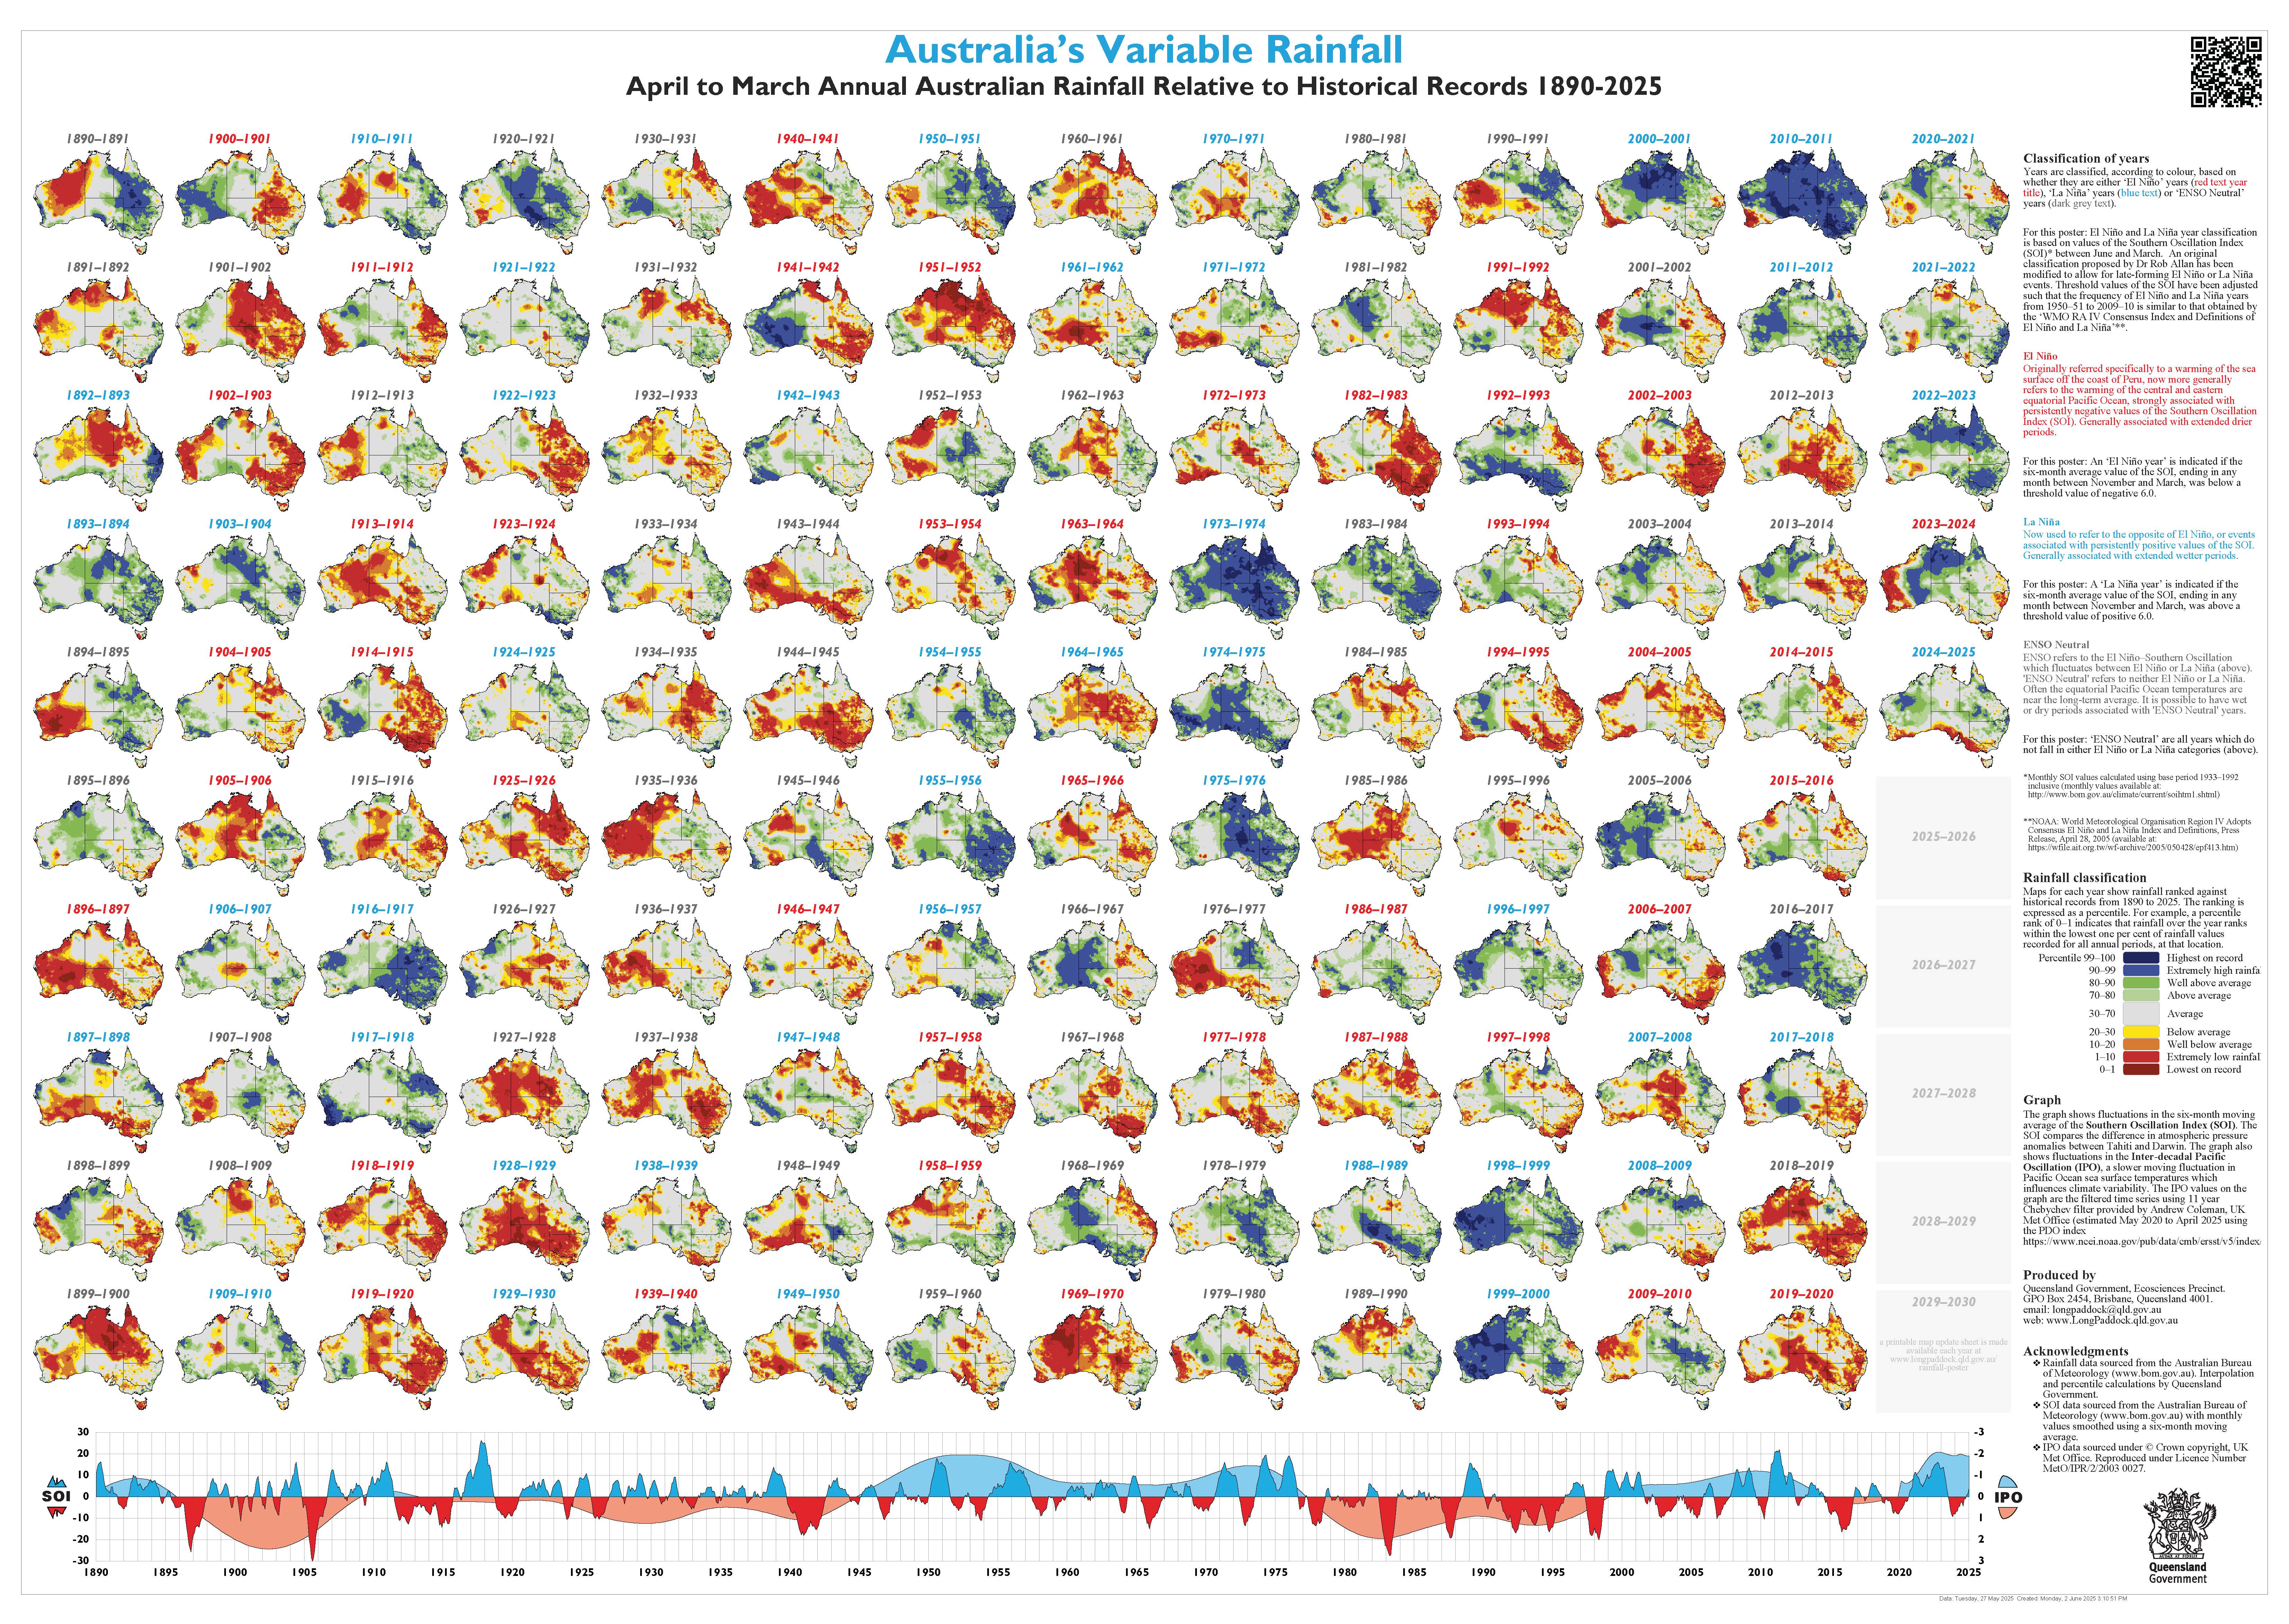
Australia's Variable Rainfall
Posters showing inter-annual (April to March) rainfall variability for Australia
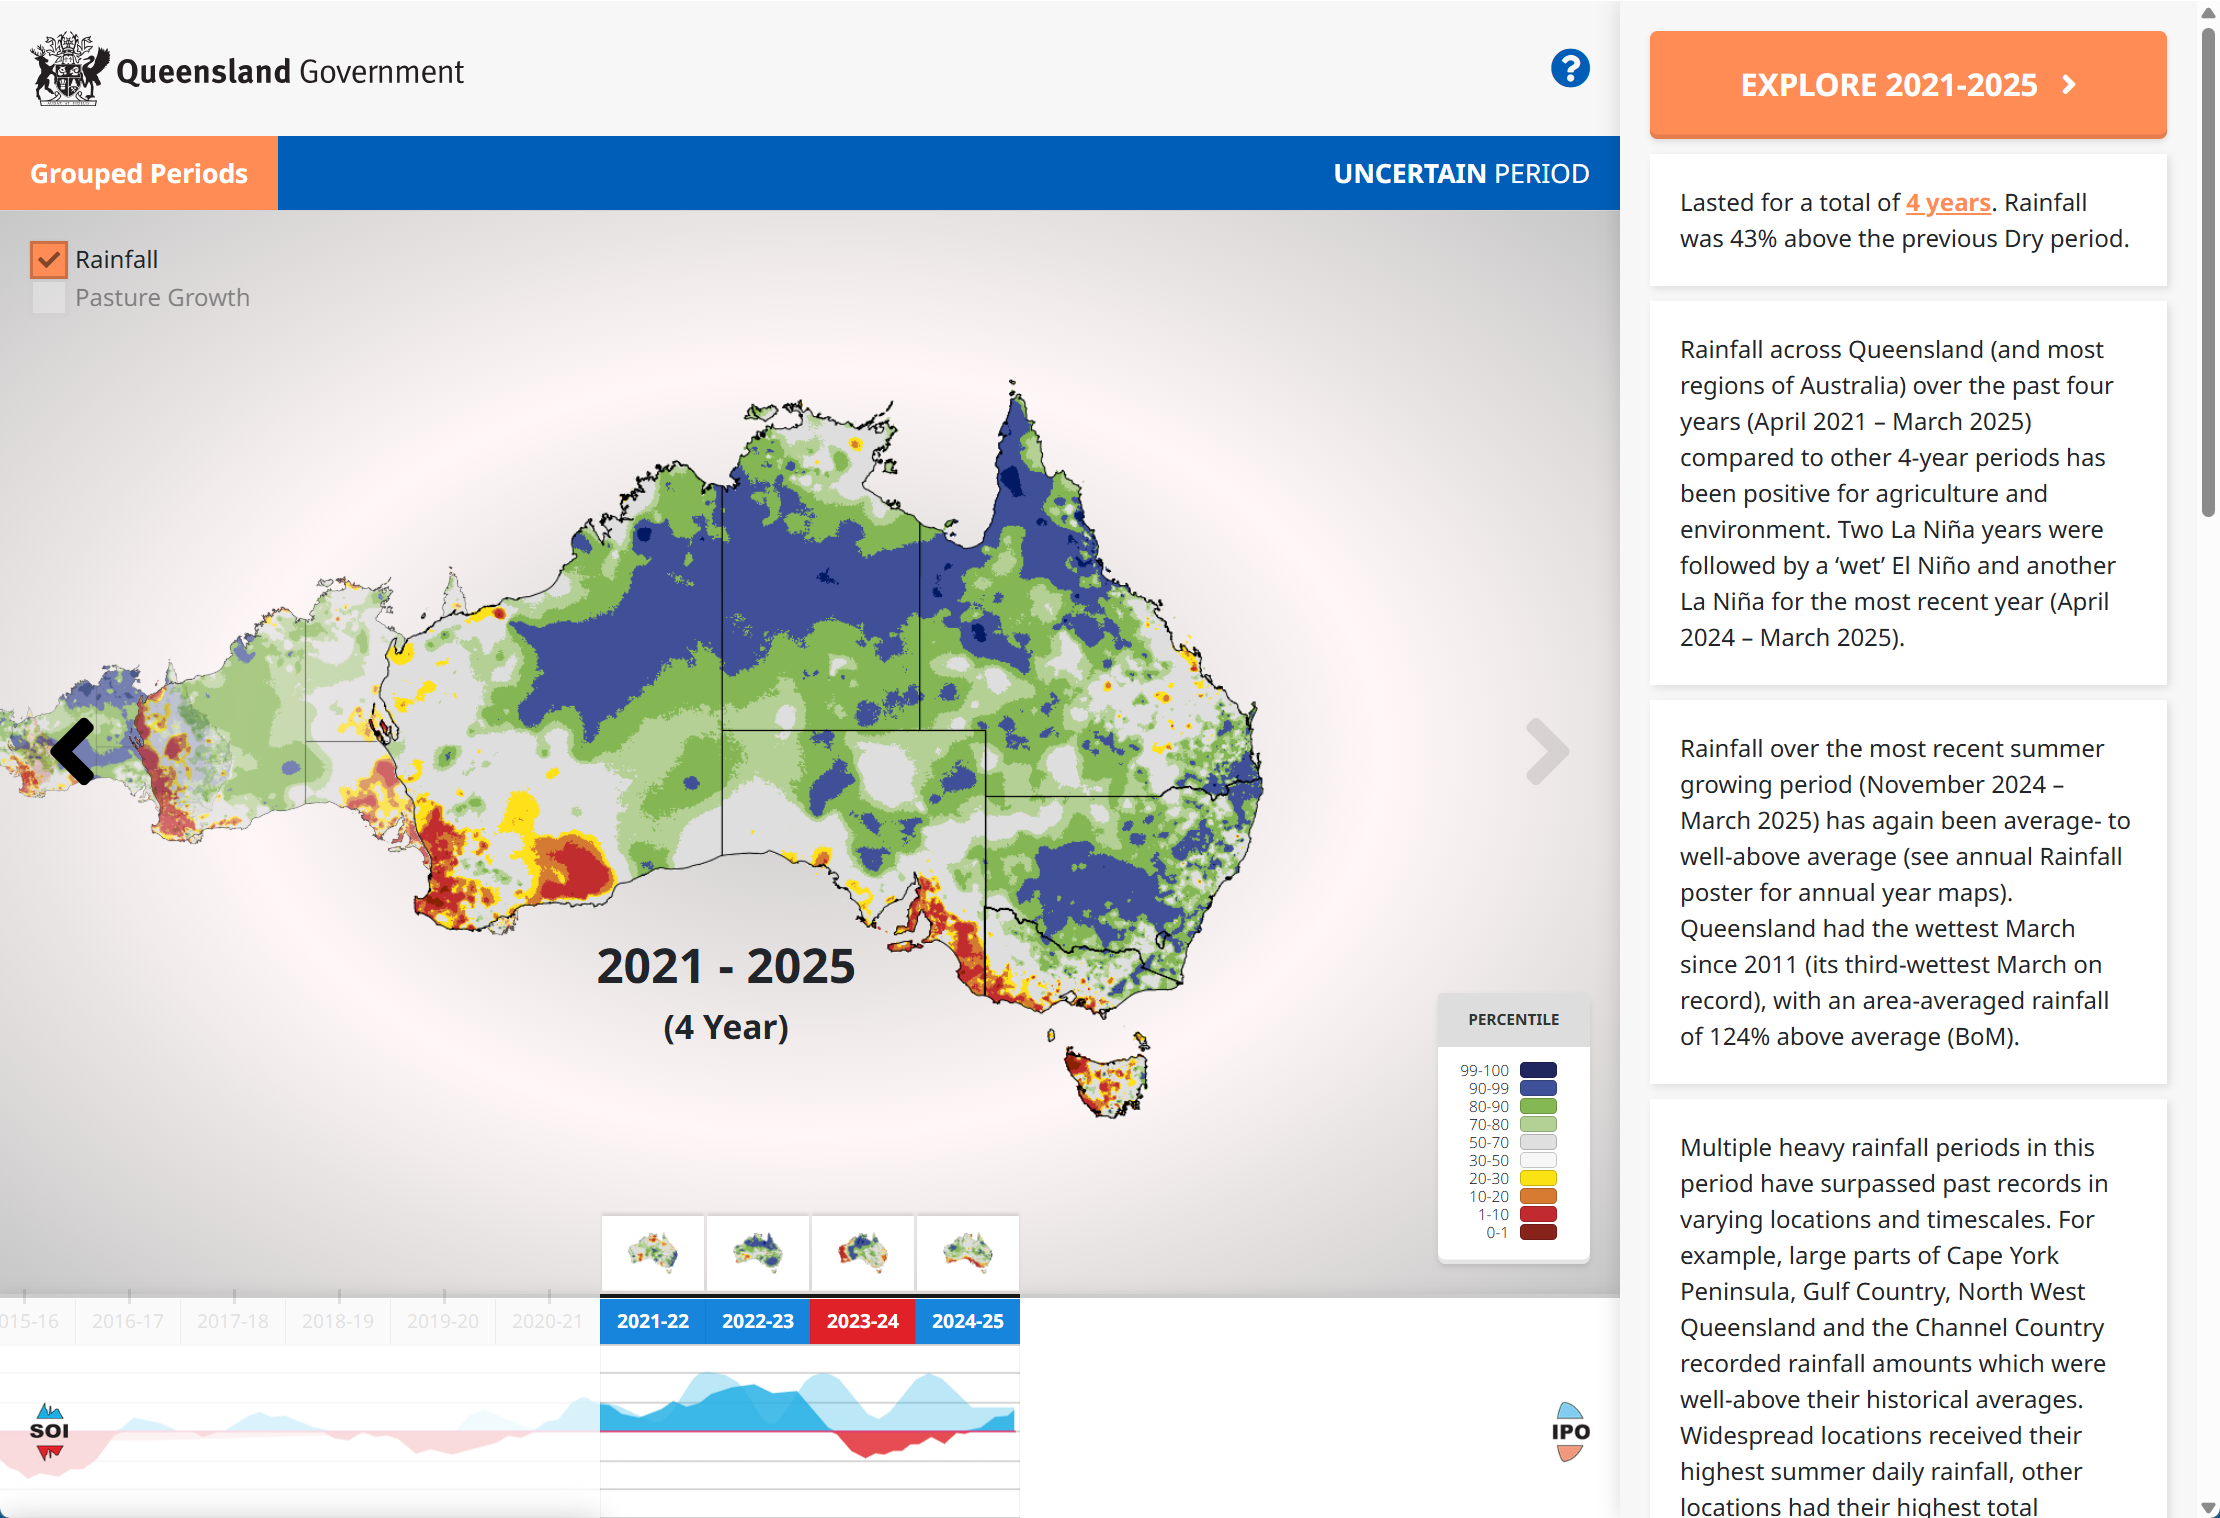
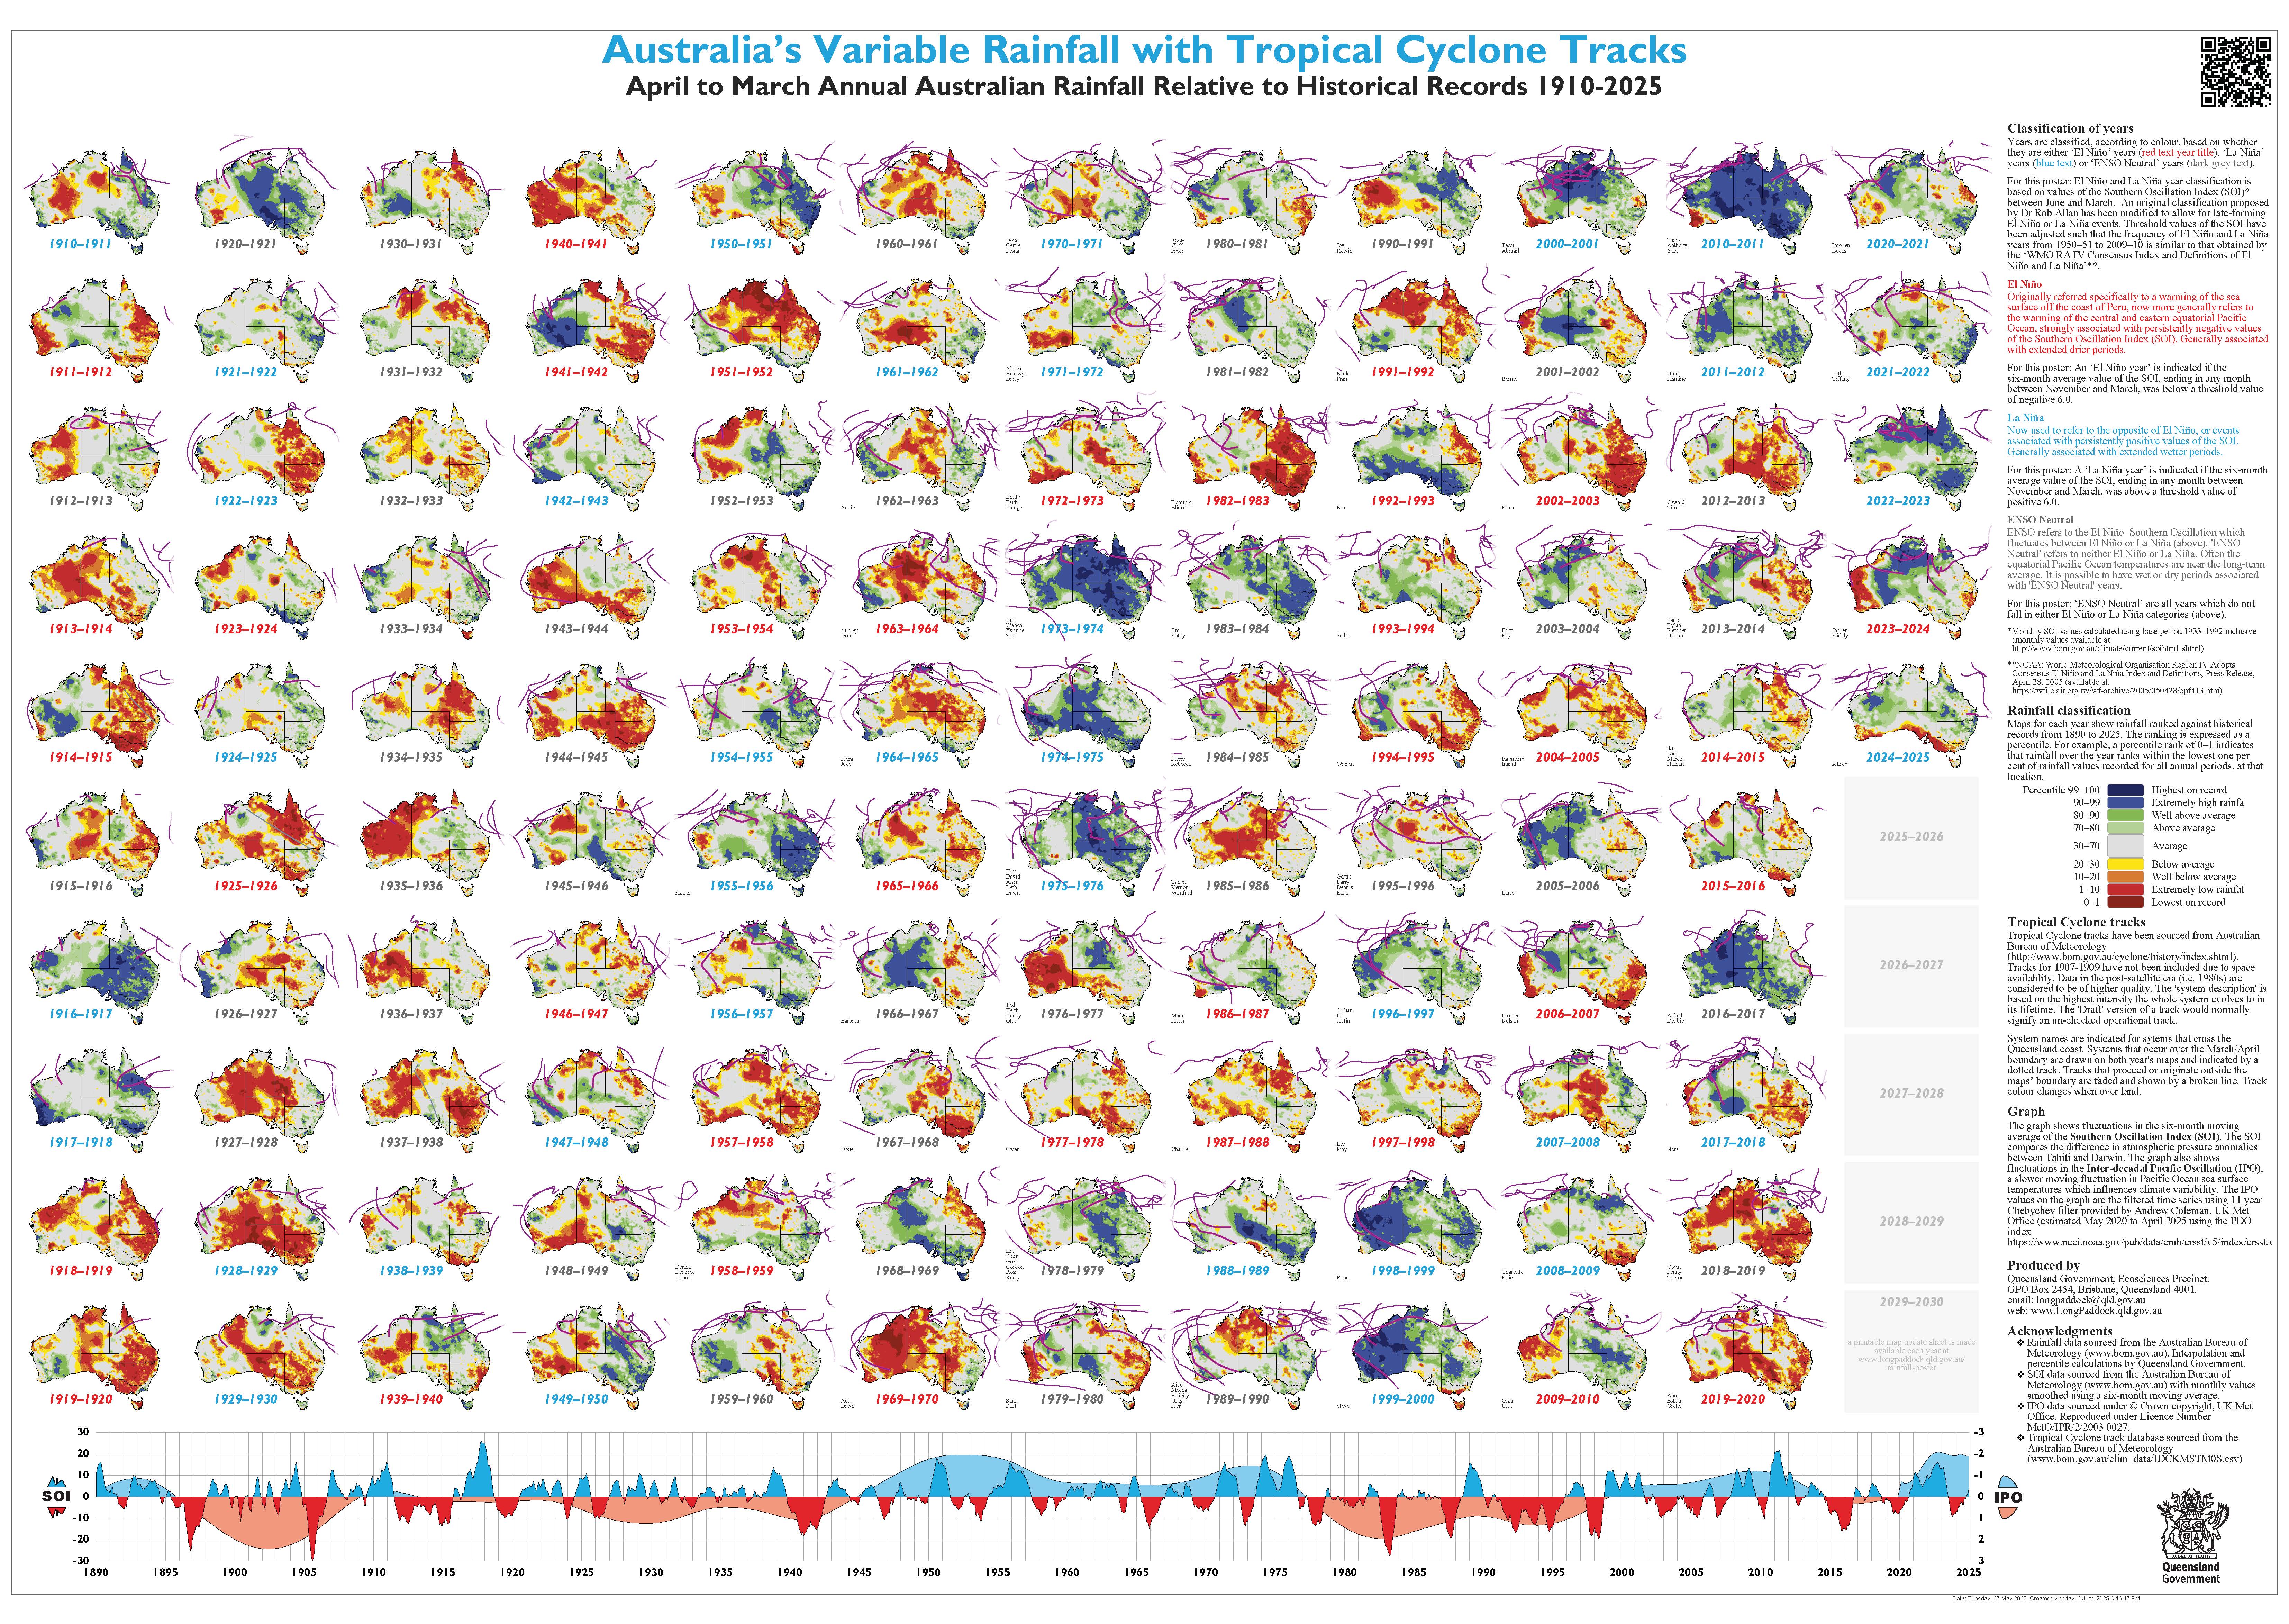
This version of Australia's Variable Rainfall Poster depicts twelve monthly rainfall (April-March) in maps for the years 1890 through to 2026 alongside a graph of Southern Oscillation Index and Interdecadal Pacific Oscillation values.
Australia's Variable Rainfall poster (1890 – 2026) (PDF, 11.3MB)
Note: This poster replaces previous versions that covered periods 1900 to 1997, 1890 to 2004, 1890 to 2013 and 1890 to 2015. The April to March period best captures El Niño–Southern Oscillation (ENSO) periods and is useful in most areas of the country.
- 2-page quick guide for Rainfall, pasture growth and Wet & Dry posters. (PDF, 951 KB)
- Maps for updating the previous versions of the posters. (PDF, 9.7MB) This update contains maps for years (2024/25 and 2025/26) for all posters and can be used to extend your current A1 printed posters to 2025/26.
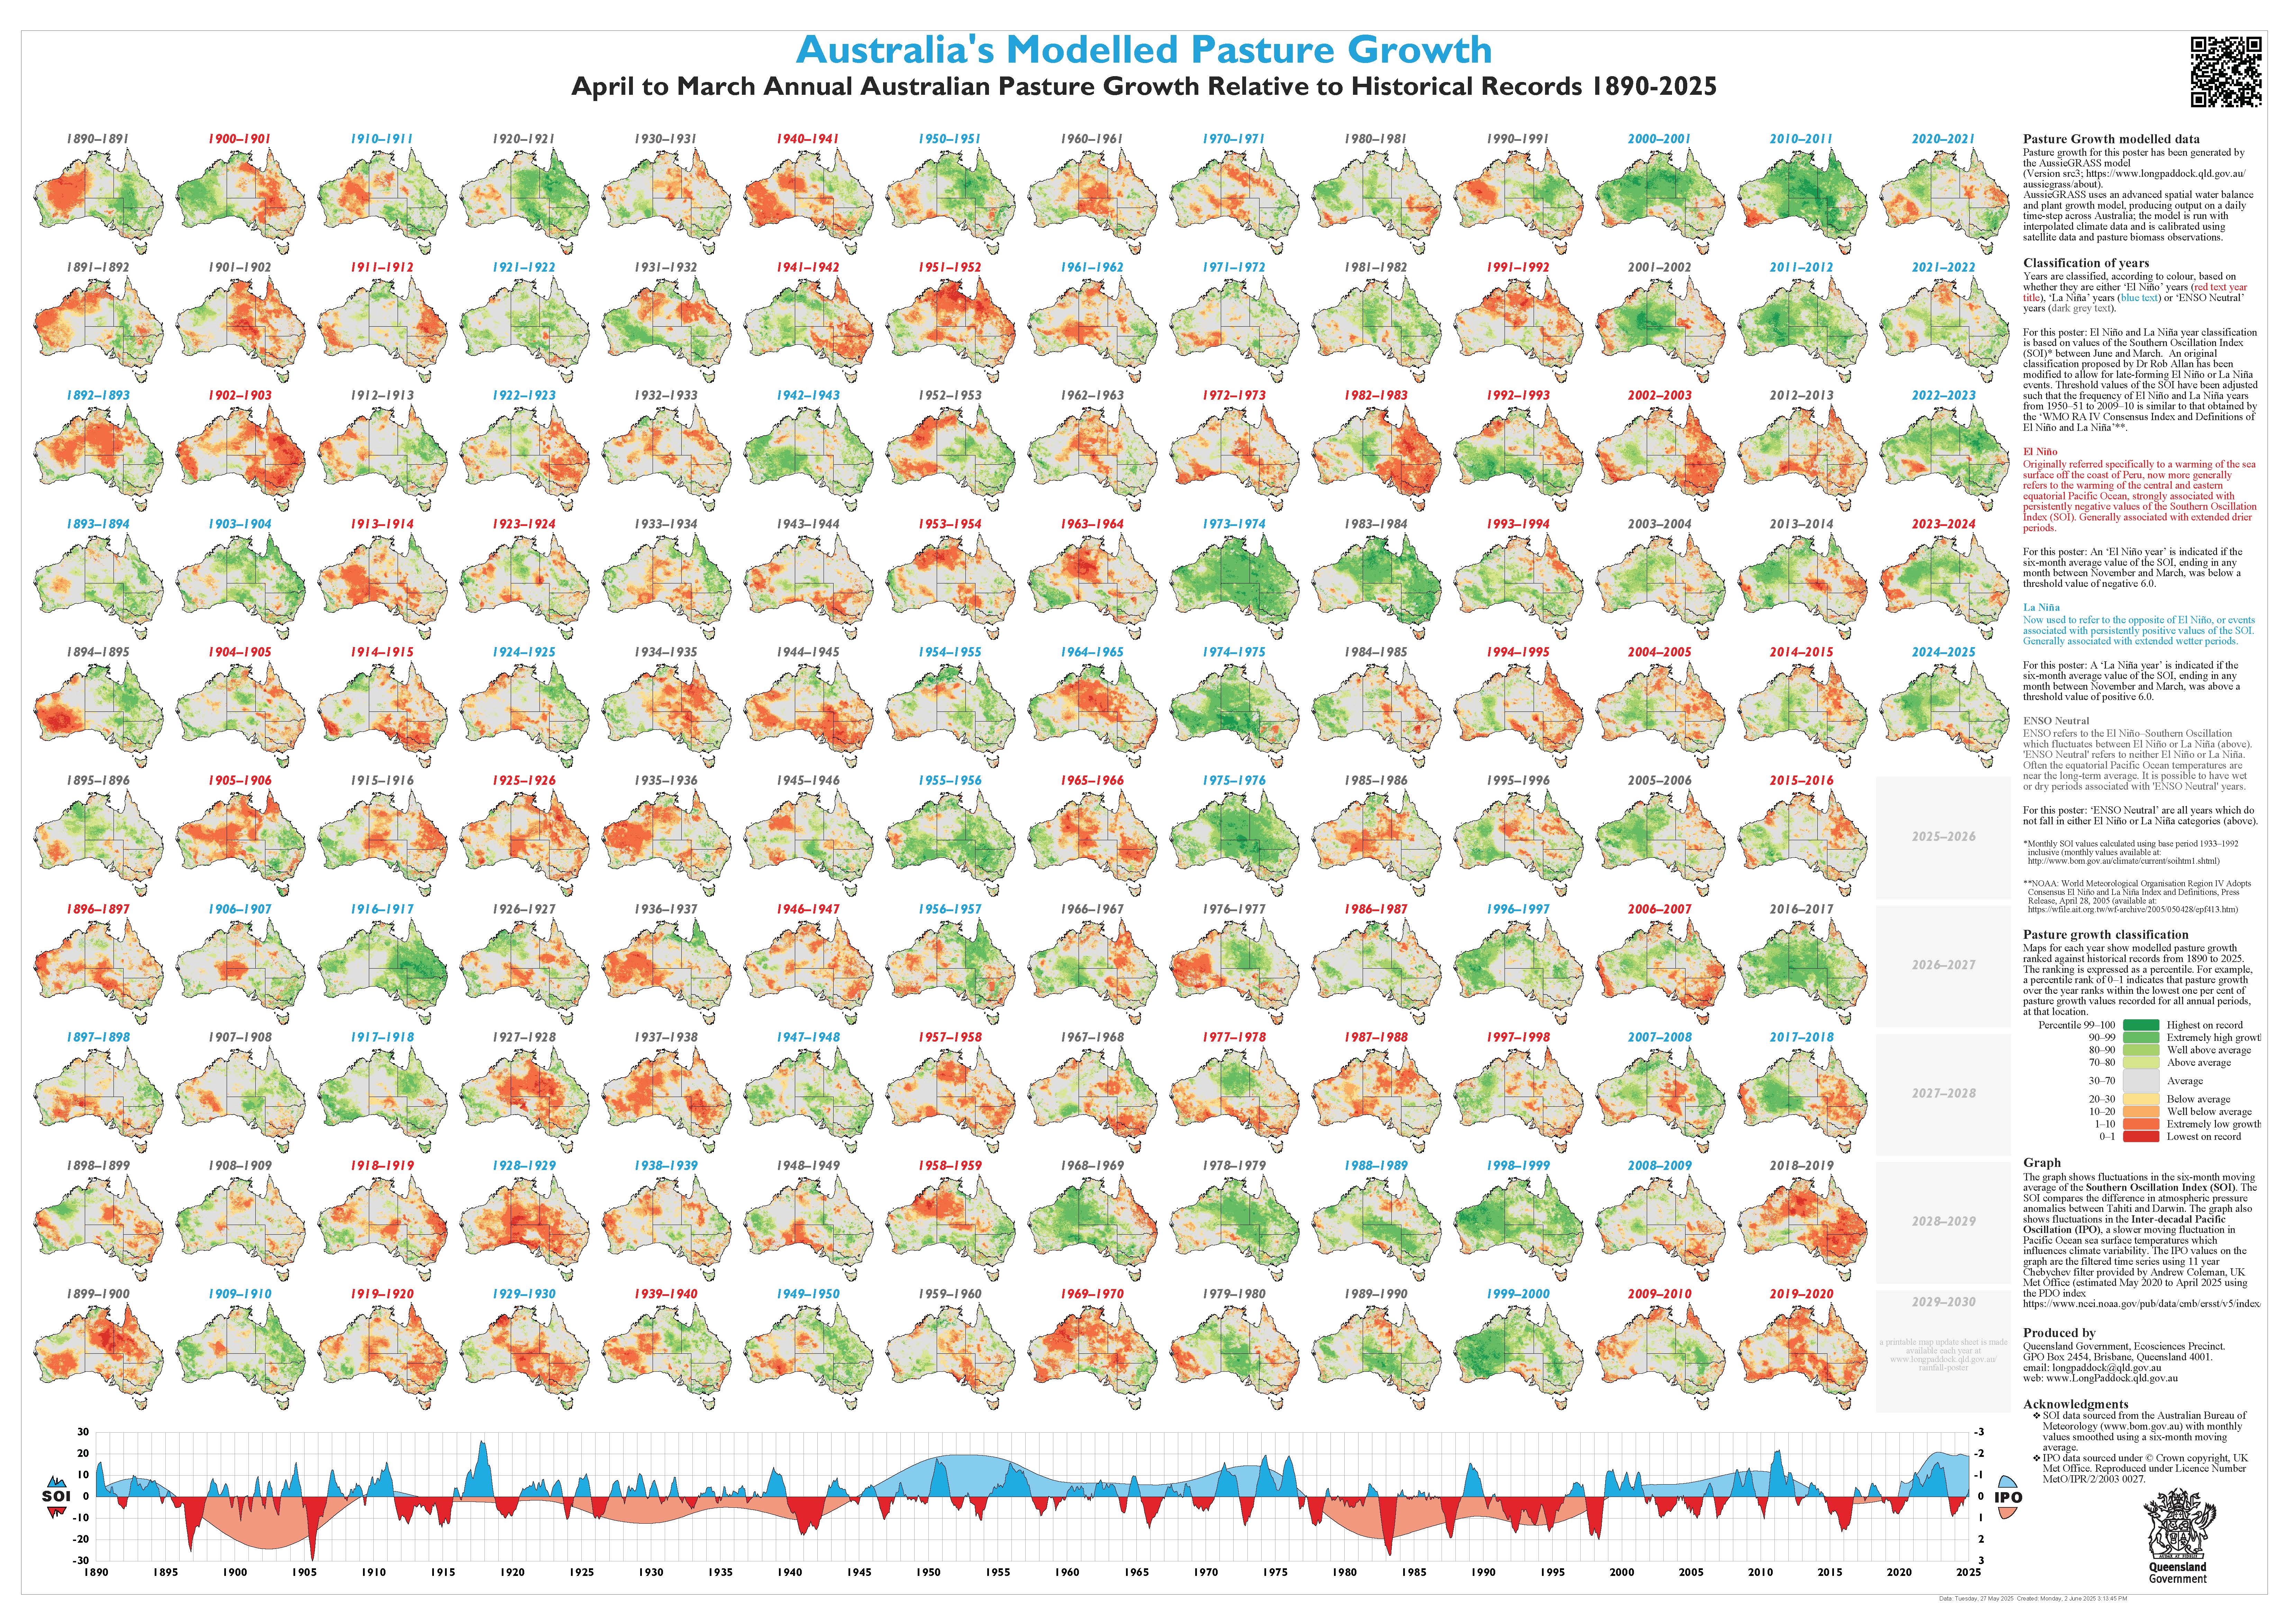
Poster Series


Reference
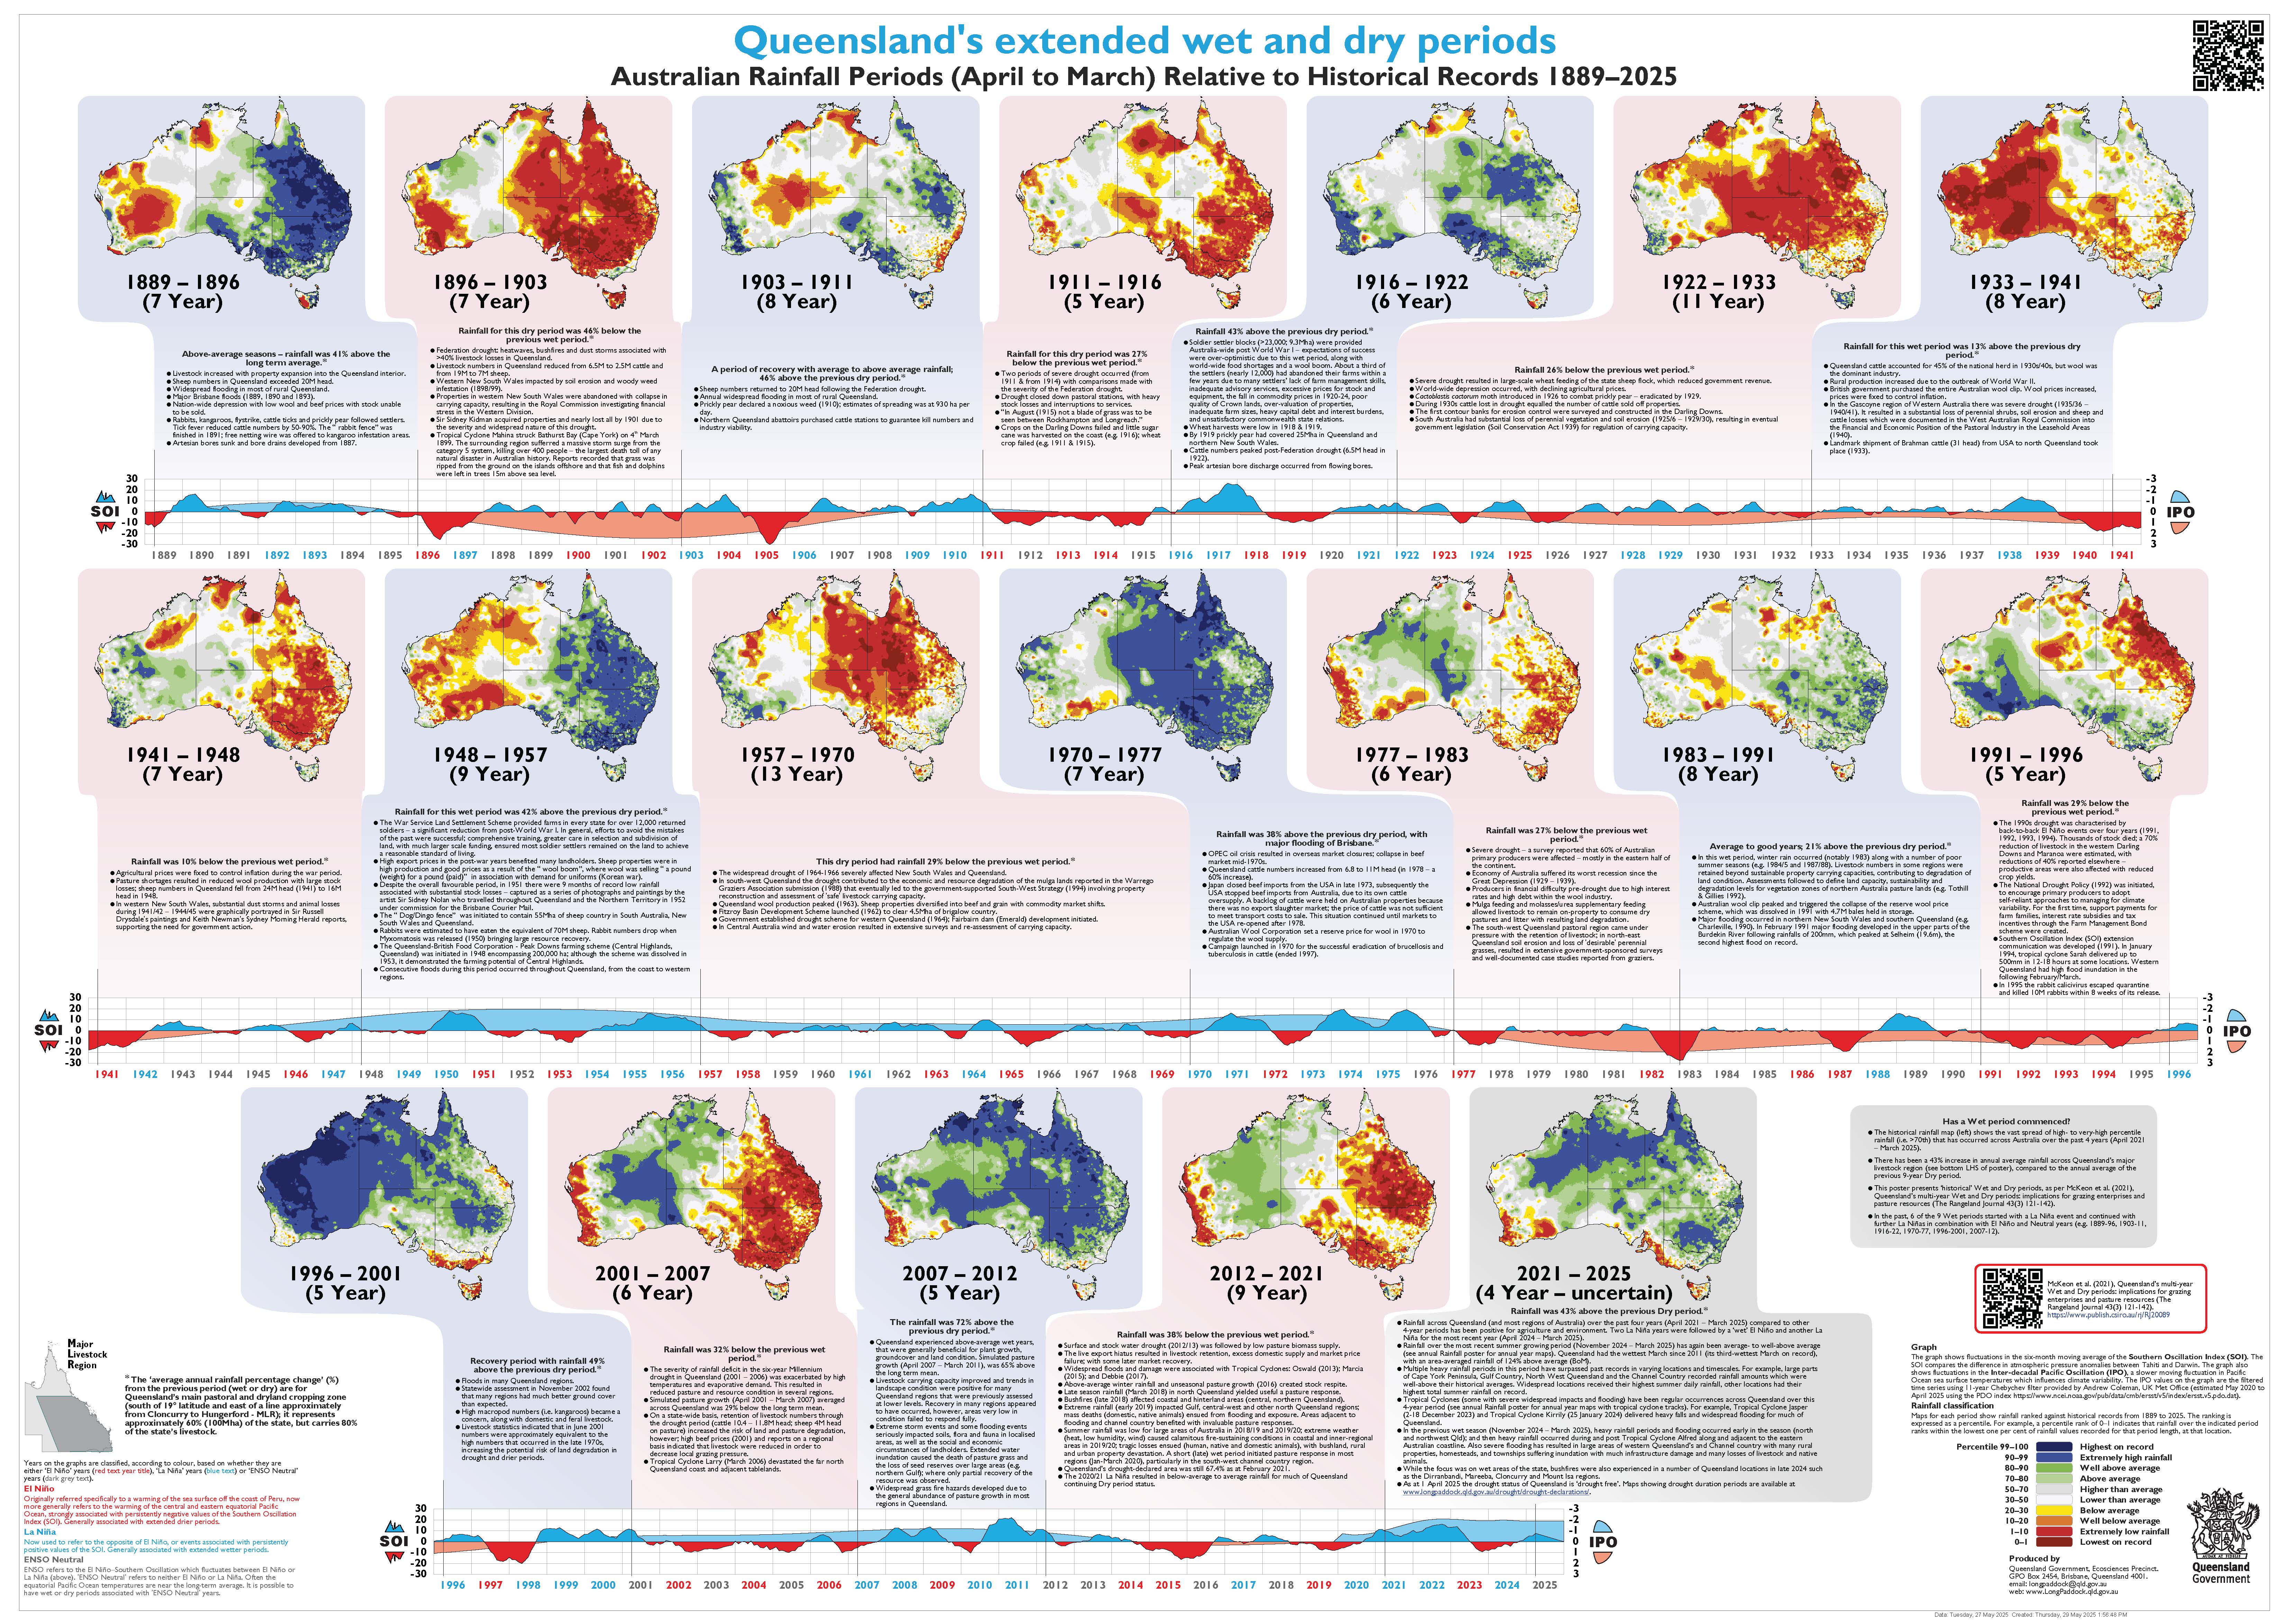
McKeon G., Stone G., Ahrens D., Carter J., Cobon D., Irvine S. and Syktus J. (2021). Queensland’s multi-year Wet and Dry periods: implications for grazing enterprises and pasture resources. The Rangeland Journal 43(3) 121-142
Data for graphs as shown in the posters
- Data for the six-month moving average of the Southern Oscillation Index (SOI) [sourced from the Australian Bureau of Meteorology from monthly values].
- Data for the Tripole Index (TPI) [sourced from NOAA derived from ERSST V5 filtered: Standard PSL Format]
