Time Series Graphs of sub-IBRA and Shire/LGA Regions
Shire and Local Government Area regions
These graphs/data are for over 500 shire and local government areas across Australia. Data is extracted and averaged for the area of each shire or local government area for a range of simulated variables and climate data. For pasture utilisation calculations only those areas grazed by domestic stock are included in the calculation.
Sub-IBRA regions
These graphs/data are for vegetation types derived from the Interim Biogeographical Regionalisation of Australia (IBRA). Graphs are provided for over 480 sub-IBRA regions in Australia. Sub-IBRA regions (version 7.0) extending across state boundaries are split into their respective states. Data is extracted and averaged for the area of each sub-IBRA region for a range of simulated variables and climate data. For pasture utilisation calculations only those areas grazed by domestic stock are included in the calculation.
To access maps or data files:
- Go to the AussieGRASS main interface and select 'Time series graphs' (alternatively use the ‘Access the Time series graphs’ button above)
- Select State - or use mouse to pan around map, then zoom to region of interest, or
- Select region from "Region" checkboxes (Shire/LGA and sub-IBRA) and scroll down the drop-down menu
- Select ‘Time series graphs’ or ‘Data file’ buttons to open graphs or data file in a new window
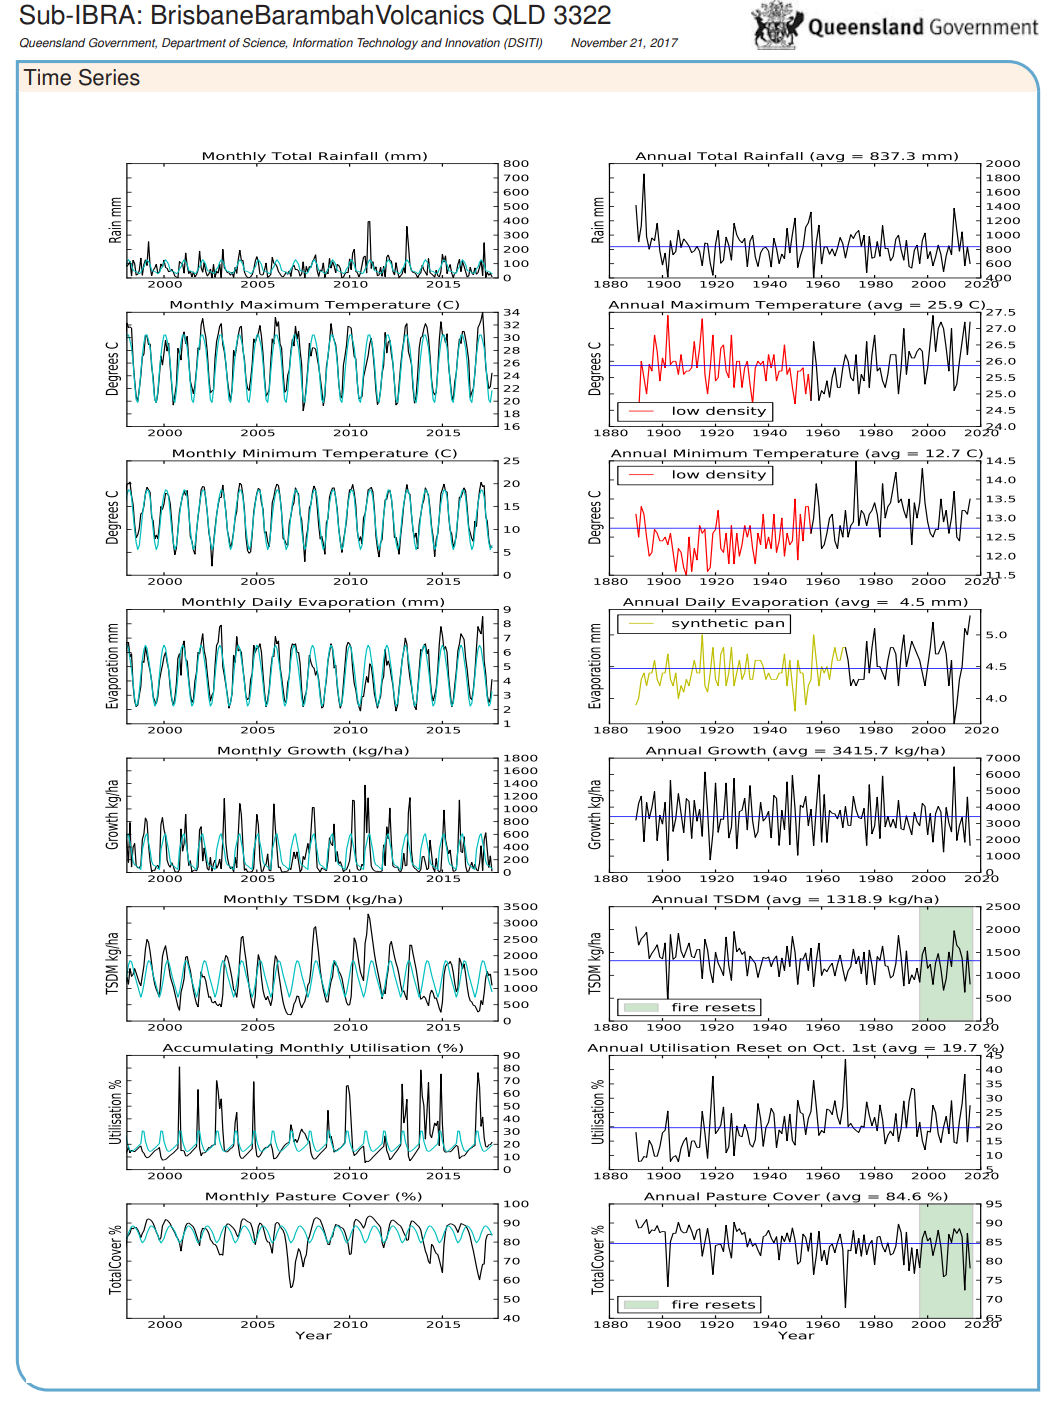
Time series graphs of climate and pasture variables on a sub-IBRA and Shire/LGA basis
Shire and sub-IBRA graphs are available as PDF files, as well as data text files for annual time-series from 1890 to the most recent calendar year, plus monthly time-series for recent decades (1990 onwards) for the following variables:
- Evaporation
- Maximum and minimum temperature
- Pasture growth
- Total rainfall
- Total standing dry matter
- Pasture utilisation
- Pasture cover
- Green Cover Plots - an indication of Break of Season (LGA maps only)
Sample PDF regional graphs
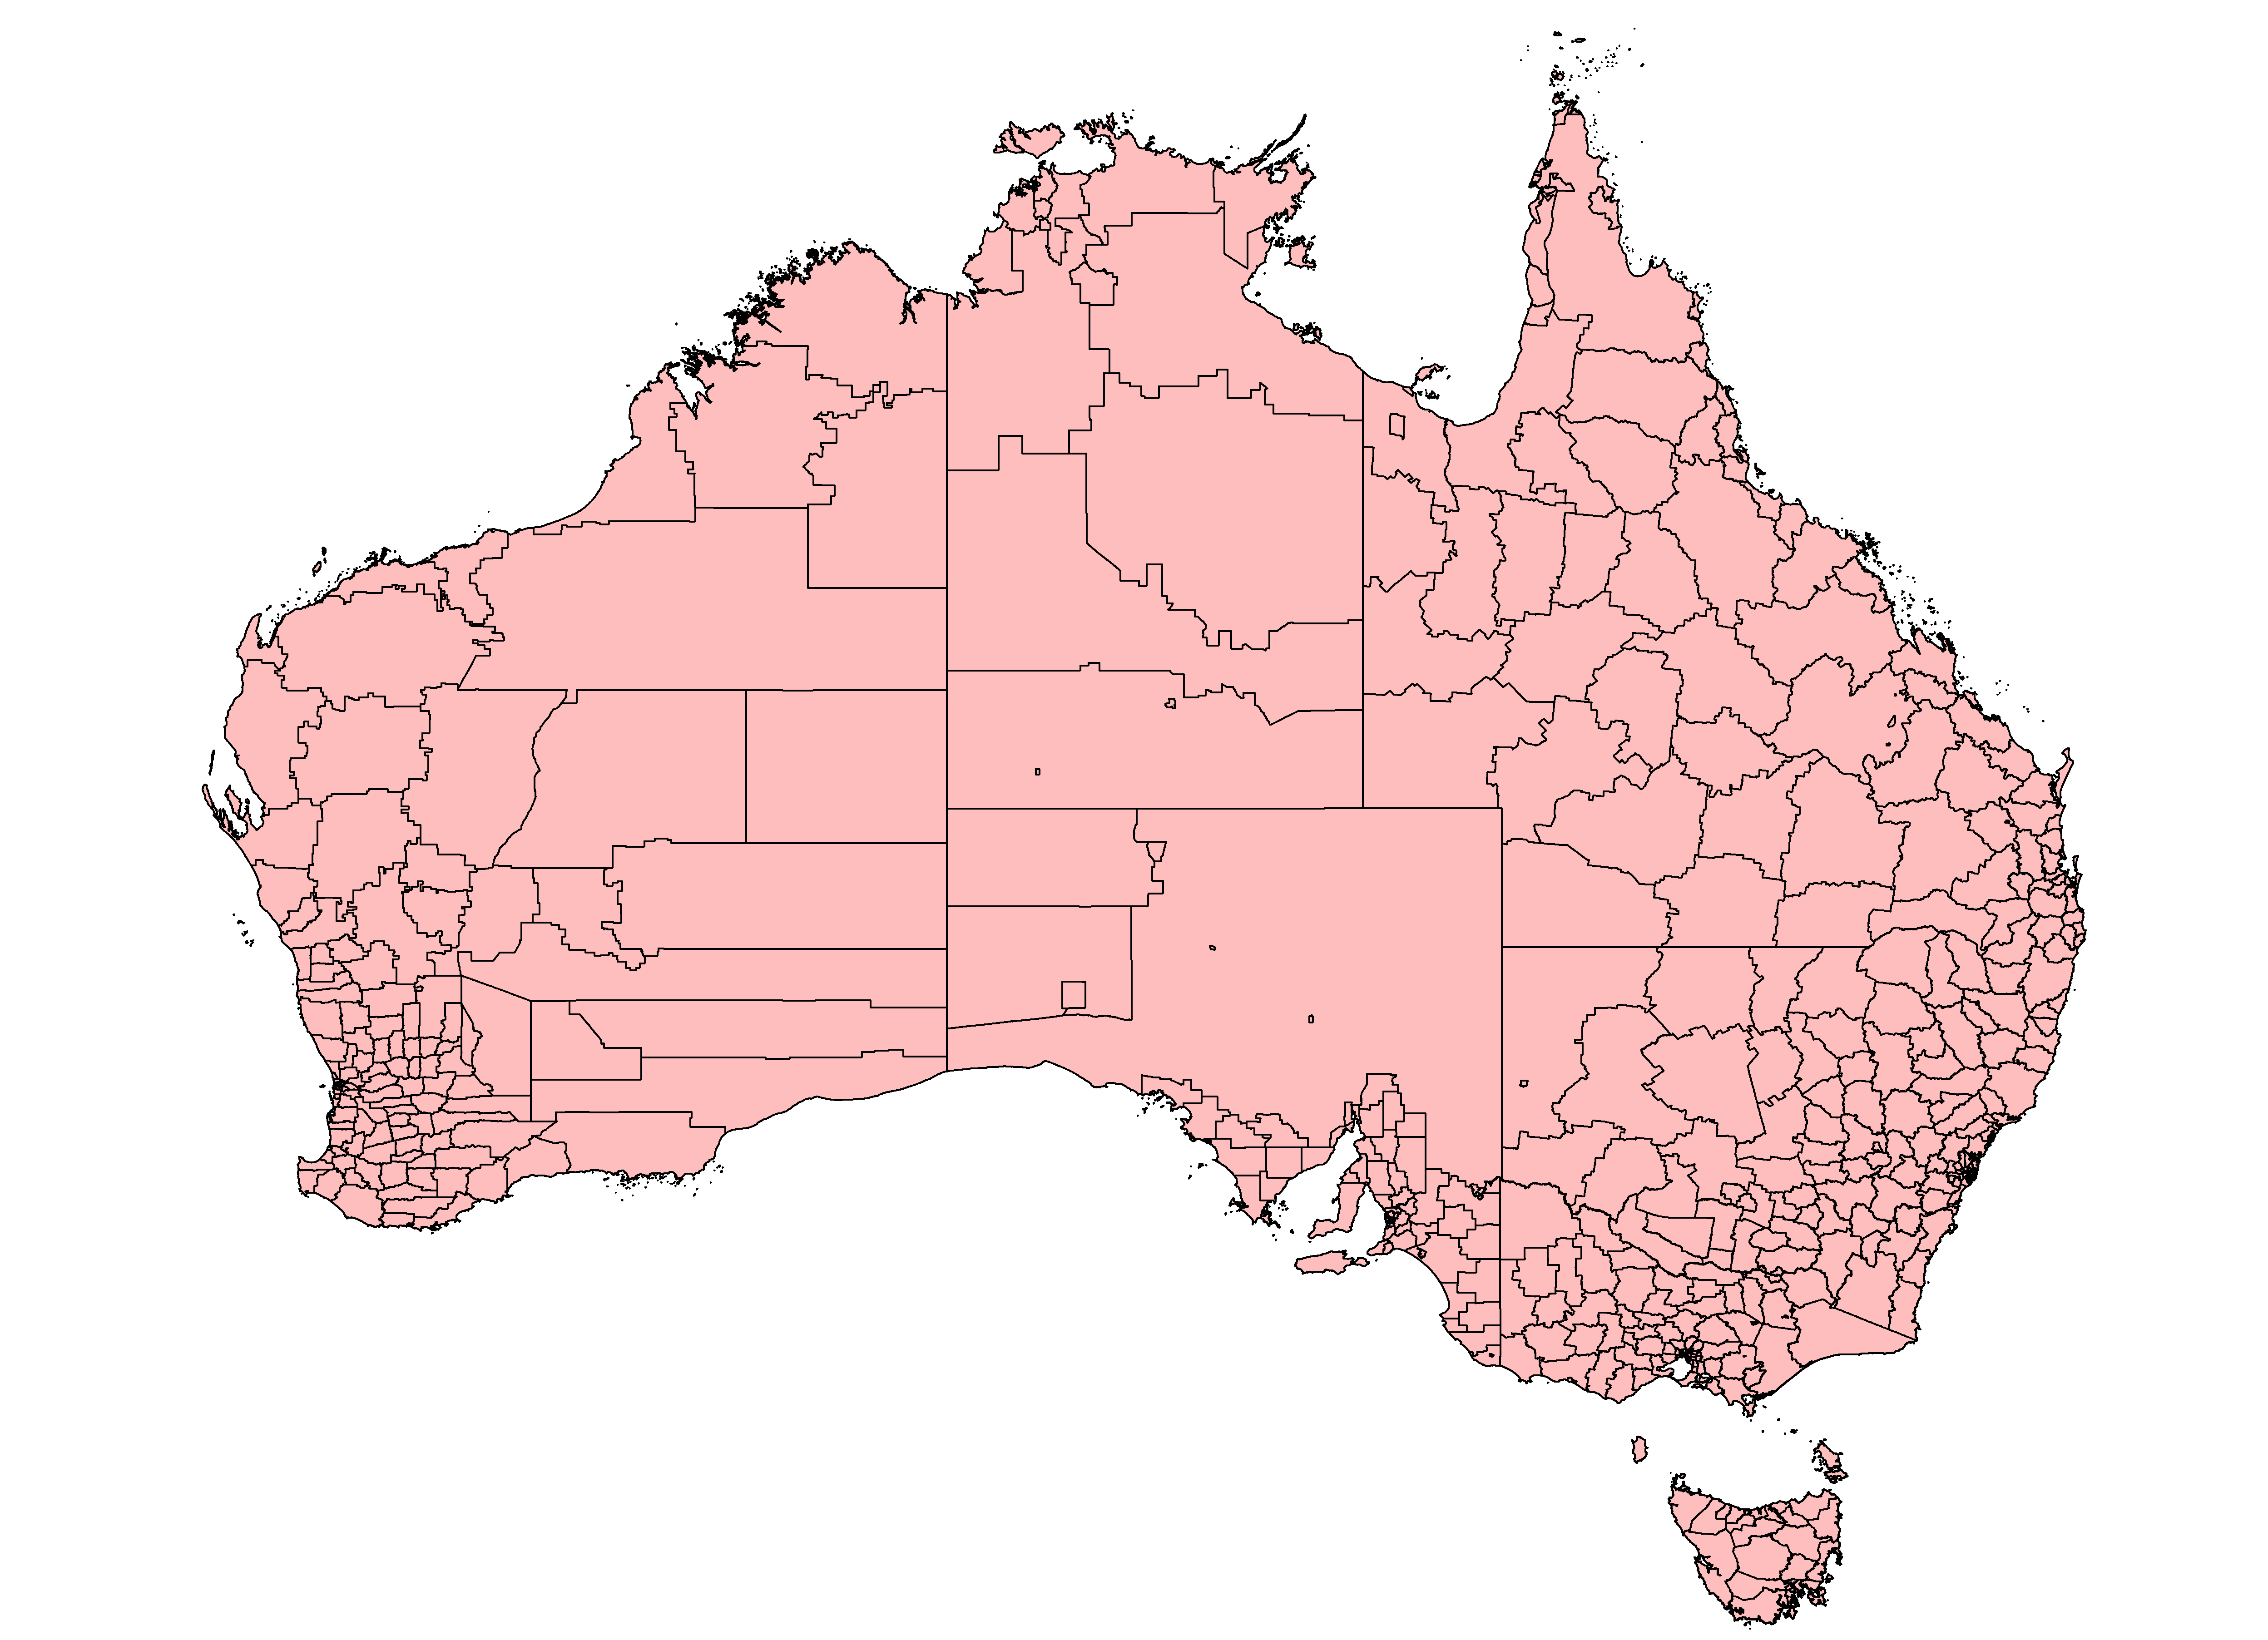
Shire/LGA map
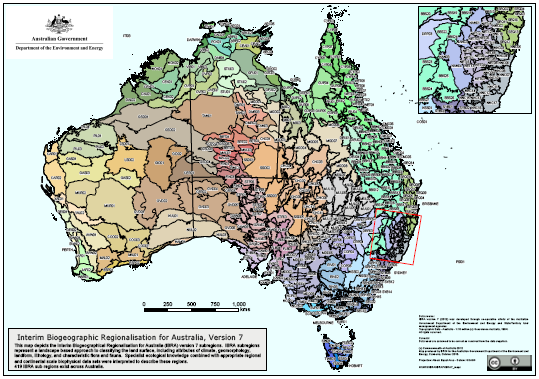
sub-IBRA map
Other information
The following products may also be available on application:
- Access to daily estimates of fuel load via FTP
- Experimental products and customised analyses
